

Question: I attach to this file a data set on 19 rats. The data set includes four variables: Body Weight (in grams), Liver Weight (in grams),
I attach to this file a data set on 19 rats. The data set includes four variables: Body Weight (in grams), Liver Weight (in grams), and two other variables you can ignore for this question. I want you to make a scatter plot (using Excel or R) for predicting Liver Weight from Body Weight and add the least squares regression line. Please label the axes appropriately.
Predict the weight of the liver of a rat weighing 155 g. Please show your work and explain how you found the numbers you used.
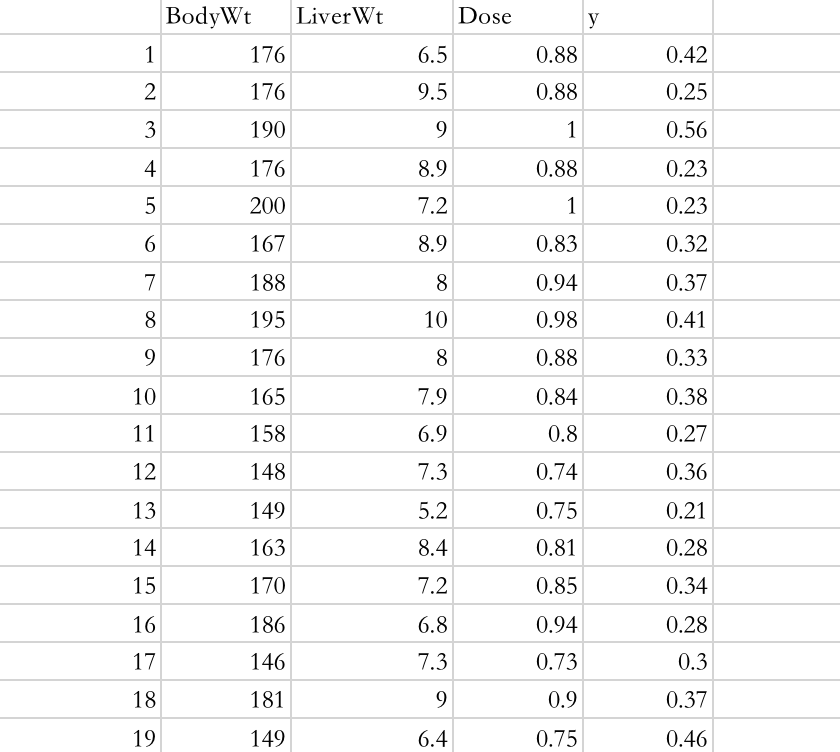
BodyWt Liver Wt Dose y 176 6.5 0.88 0.42 176 9.5 0.88 0.25 190 9 0.56 4 176 8.9 0.88 0.23 UI 200 7.2 0.23 6 167 8.9 0.83 0.32 188 8 0.94 0.37 8 195 10 0.98 0.41 9 176 8 0.88 0.33 10 165 7.9 0.84 0.38 11 158 6.9 0.8 0.27 12 148 7.3 0.74 0.36 13 149 5.2 0.75 0.21 14 163 8.4 0.81 0.28 15 170 7.2 0.85 0.34 16 186 6.8 0.94 0.28 17 146 7.3 0.73 0.3 18 181 9 0.9 0.37 19 149 6.4 0.75 0.46
Step by Step Solution
There are 3 Steps involved in it

Get step-by-step solutions from verified subject matter experts