

Question: I can get about halfway through this problem but I'm stuck. Please help if you can! help if you can! AutoSave OFF A B 2.C
I can get about halfway through this problem but I'm stuck. Please help if you can!
 help if you can!
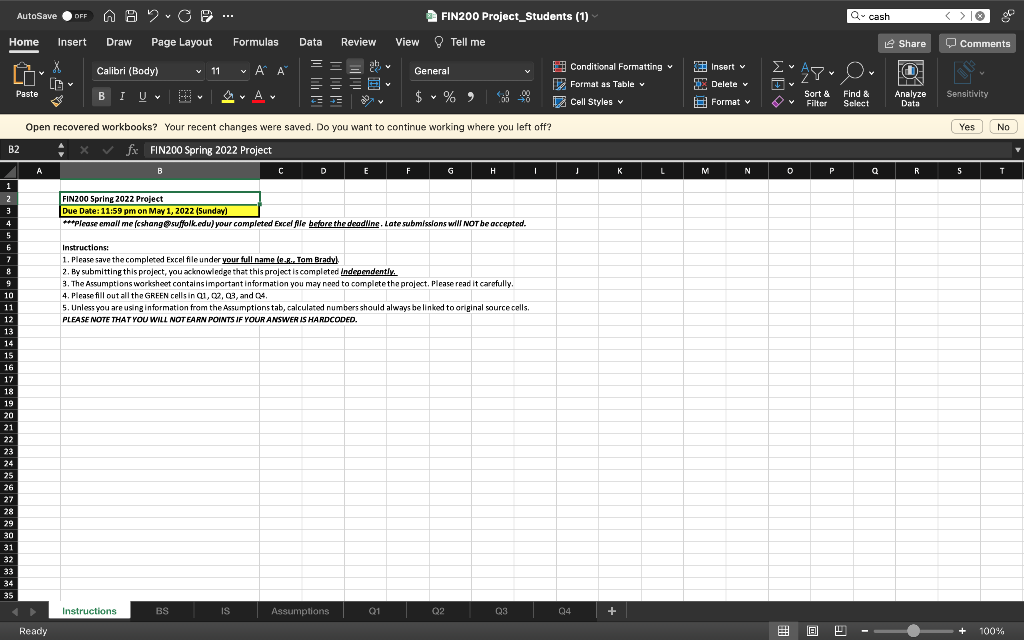
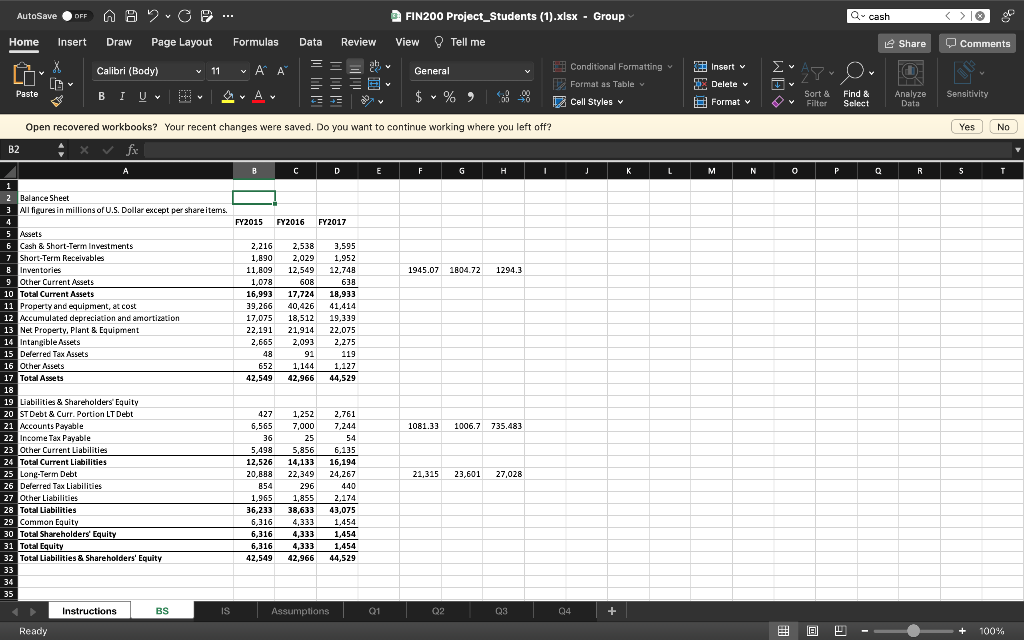
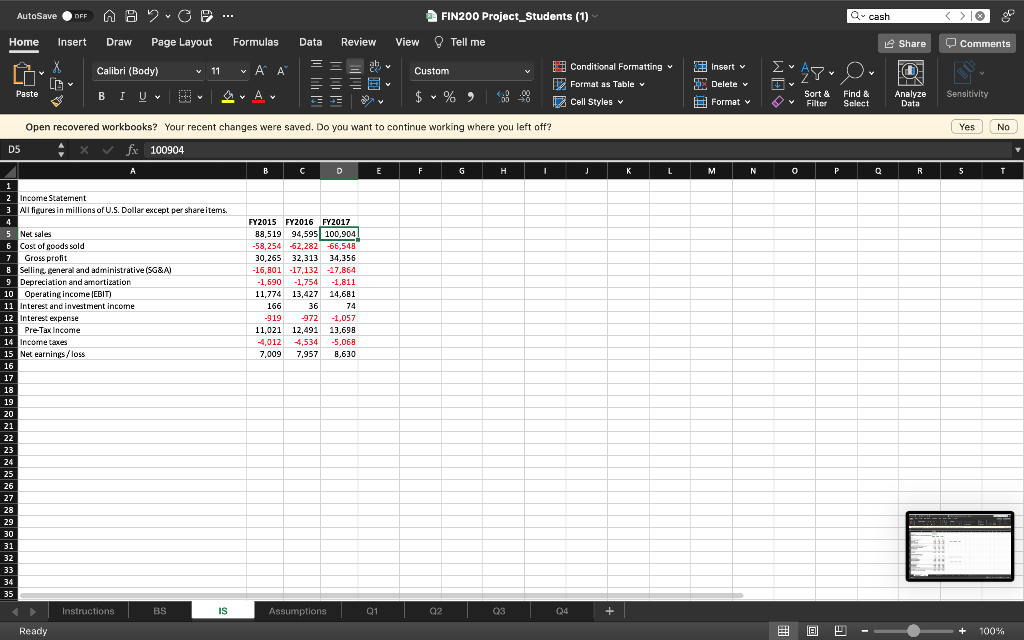
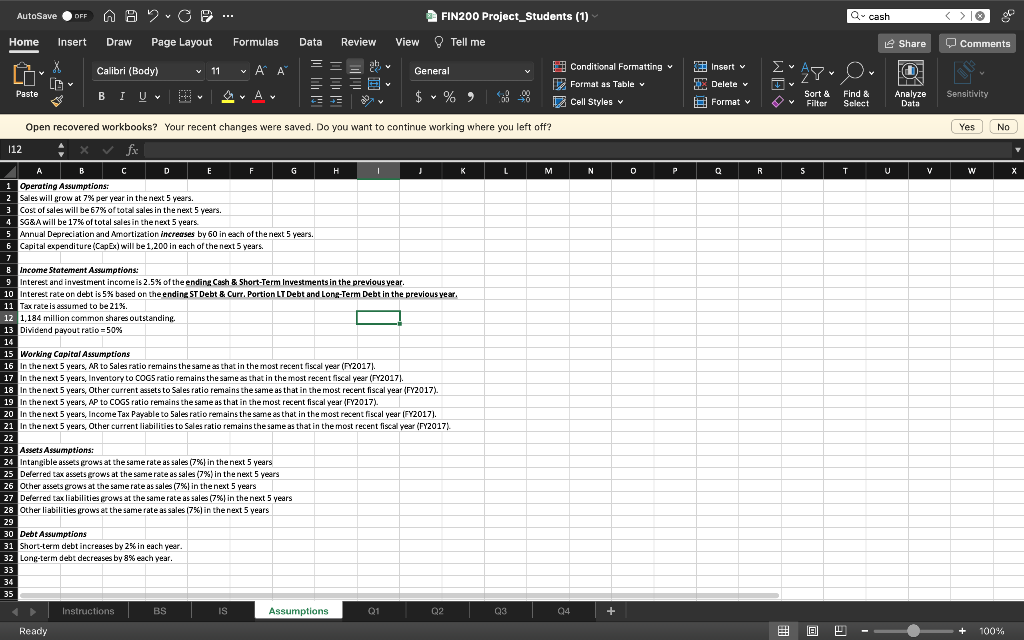
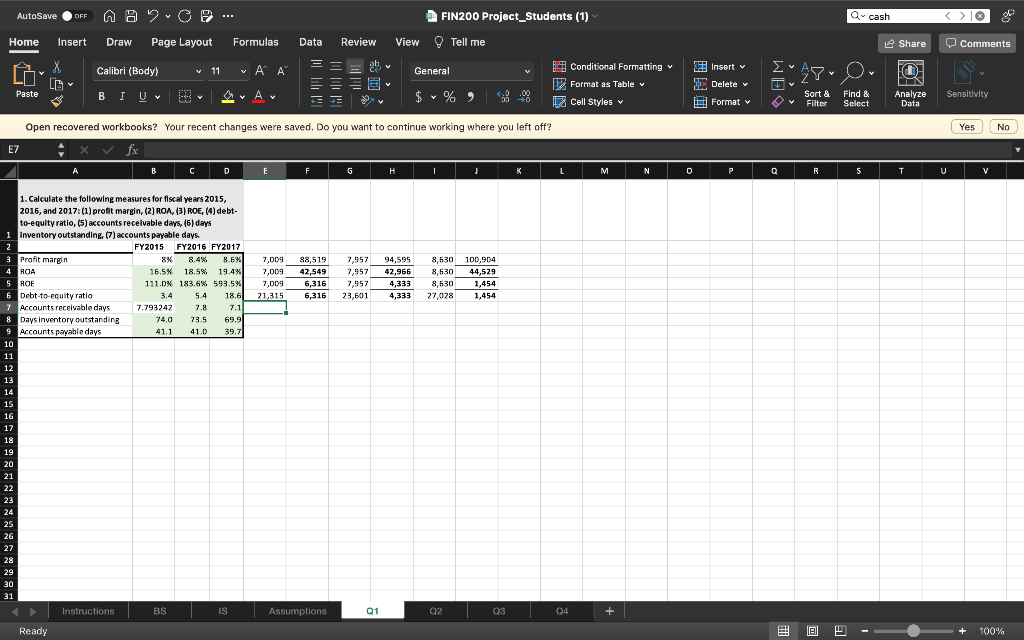
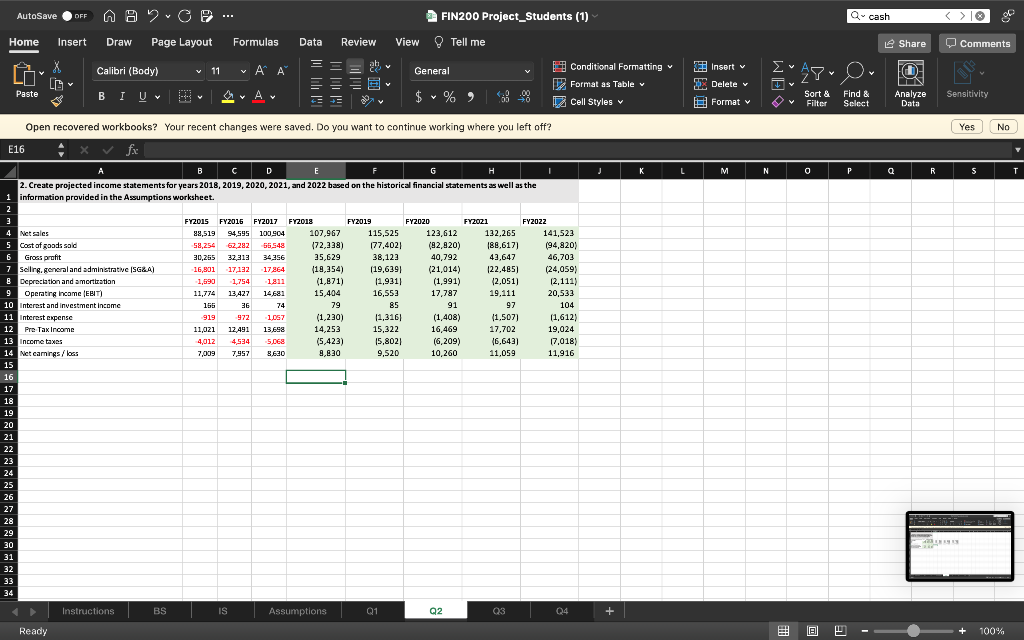
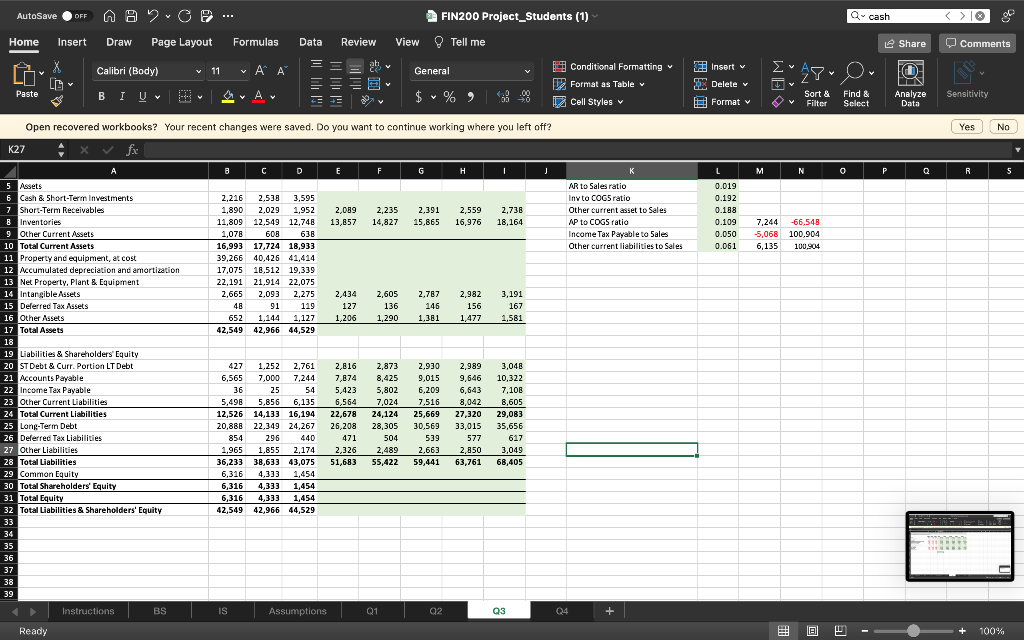
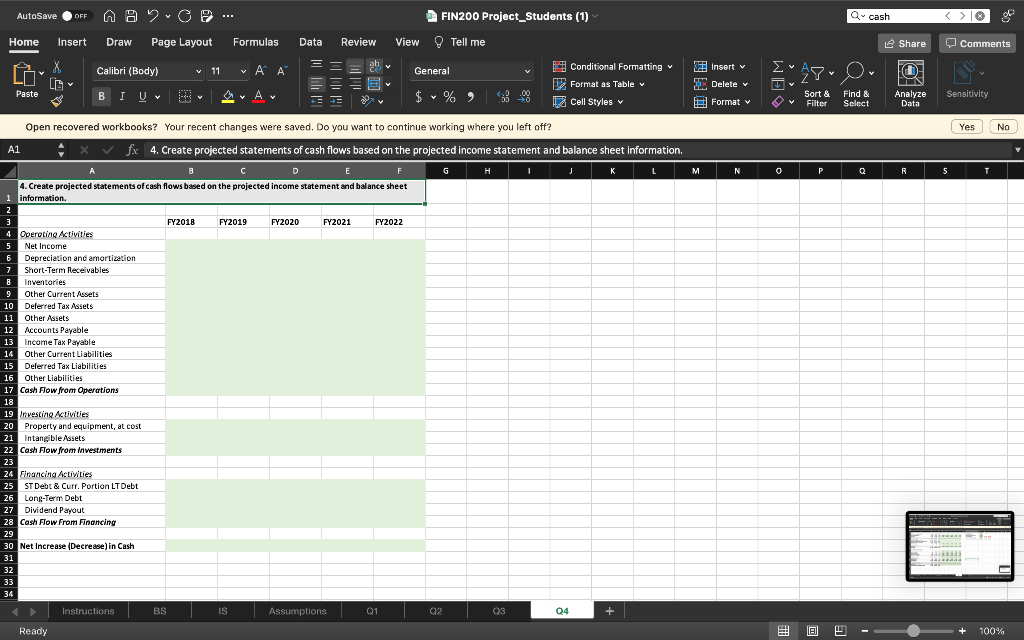
AutoSave OFF A B 2.C ? - Home Insert Draw Page Layout Formulas Data Review View Conditional Formatting G Calibri (Body) 11 General 8. Format as Table Paste BIU $ % 9 Je 43 Cell Styles v Open recovered workbooks? Your recent changes were saved. Do you want to continue working where you left off? B2 fx FIN200 Spring 2022 Project A B D E F G HI J K FIN200 Spring 2022 Project Due Date: 11:59 pm on May 1, 2022 (Sunday) ***Please email me (cshang@suffolk.edu) your completed Excel file before the deadline. Late submissions will NOT be accepted. Instructions: 1. Please save the completed Excel file under your full name (e.g., Tom Brady). 2. By submitting this project, you acknowledge that this project is completed Independently. 3. The Assumptions worksheet contains important information you may need to complete the project. Please read it carefully. 4. Please fill out all the GREEN cells in 01, 02, 03, and 04. 5. Unless you are using information from the Assumptions tab, calculated numbers should always be linked to original source cells. PLEASE NOTE THAT YOU WILL NOT EARN POINTS IF YOUR ANSWER IS HARDCODED. BS IS Assumptions Q1 Q2 Q3 Q4 1 2 3 4 5 6 7 8 9 10 11 12 13 14 15 16 17 18 19 20 21 22 23 24 25 26 27 28 29 30 31 32 33 34 35 Ready Instructions FIN200 Project_Students (1) Tell me + L DMO M Insert v Delete v Format v N Q- cash Share [80 TO D & Sort & Find & Filter Select Analyze Data V 0 P R # |18| L Q Comments Sensitivity Yes 5 No T 100% AutoSave OFF A 2.C P .. FIN200 Project_Students (1).xlsx - Group Home Insert Draw Page Layout Formulas Data Review View Tell me Conditional Formatting G Calibri (Body) 11 ( General $ % Format as Table Paste BI Uv A % 9 08 J 43 Cell Styles Open recovered workbooks? Your recent changes were saved. Do you want to continue working where you left off? B2 x fx A B D E F G H I J 1 2 Balance Sheet All figures in millions of U.S. Dollar except per share items. 4 FY2015 FY2016 FY2017 5 Assets Cash & Short-Term Investments Short-Term Receivables 8 Inventories 2,216 2,538 3,595 1,890 2,029 1,952 11,809 12,549 12,748 1,078 608 638 16,993 17,724 18,933 1945.07 1804.72 1294.3 9 Other Current Assets 10 Total Current Assets 11 Property and equipment, at cost 12 Accumulated depreciation and amortization 13 Net Property, Plant & Equipment 14 Intangible Assets 39,266 40,426 41,414 17,075 18,512 19,339 22,191 21,914 22,075 2,093 2,275 91 119 1.144 1,127 42,966 44,529 2,665 15 Deferred Tax Assets 48 16 Other Assets 652 42,549 17 Total Assets 18 19 Liabilities & Shareholders' Equity 20 ST Debt & Curr. Portion LT Debt 2,761 427 6,565 36 1,252 7,000 21 Accounts Payable 7,244 1081.33 1006.7 735.483 22 Income Tax Payable 54 6.135 23 Other Current Liabilities 5,498 24 Total Current Liabilities 25 Long-Term Debt 25 5,856 12,526 14,133 16,194 20,888 22,349 24,267 854 296 440 1,965 1,855 2,174 36,233 38,633 43,075 21,315 23,601 27,028 26 Deferred Tax Liabilities 27 Other Liabilities 28 Total Liabilities 29 Common Equity 6,316 1,454 4,333 4.333 1,454 30 Total Shareholders' Equity 31 Total Equity 6,316 6,316 4,333 1.454 42,549 42,966 44,529 32 Total Liabilities & Shareholders' Equity 33 34 35 Instructions BS Assumptions Q2 Q3 Ready IS Q1 Q4 + K L DMO Insert v Delete v Format M N *480* Sort & Find & Filter Select P V 0 |18| Q- cash [] Q Comments Share O Analyze Sensitivity Data Yes R 5 No T 100% AutoSave OFF A B 2.C ? - Home Insert Draw Page Layout Formulas Data Conditional Formatting G Calibri (Body) 11 Custom ( 8. Format as Table Paste BIU $ % 9 J 43 Cell Styles v Open recovered workbooks? Your recent changes were saved. Do you want to continue working where you left off? D5 fx 100904 A B C D E F G H I J 2 Income Statement 3 All figures in millions of U.S. Dollar except per share items. 4 5 Net sales FY2015 FY2016 FY2017 88,519 94,595 100,904 -58,254 -62,282 -66,548 6 Cost of goods sold. 7 Gross profit 30,265 32,313 34,356 -16,801 -17,132 -17,864 Selling, general and administrative (SG&A) 9 Depreciation and amortization 10 Operating income (EBIT) 11 Interest and investment income 12 Interest expense -1,690 -1.754 -1,811 11,774 13,427 14,681 166 36 74 -919 -972 -1,057 11,021 12,491 13,698 -4,012 -4,534 -5,068 7,009 7,957 8,630 13 Pre-Tax Income 14 Income taxes 15 Net earnings/loss 16 17 18 19 20 21 22 23 24 25 26 27 28 29 30 31 32 33 34 35 Assumptions Ready Instructions BS IS Review Q1 View FIN200 Project_Students (1) Tell me Q2 Q3 Q4 + K L DMO Insert v Delete v Format v M N Q- cash Share [180 O D Sort & Find & Filter Select Analyze Data & V P R 0 |18| [] Q Comments Sensitivity Yes 5 No T 100% AutoSave OFF A B 2.C ? - Home Insert Draw Page Layout Formulas Data G Calibri (Body) 11 General ( 8. Paste BIU A $ % 9 43 Open recovered workbooks? Your recent changes were saved. Do you want to continue working where you left off? 112 x fx A B C D E F G H J K L M 1 Operating Assumptions: 2 Sales will grow at 7% per year in the next 5 years. 3 Cost of sales will be 67% of total sales in the next 5 years. SG&A will be 17% of total sales in the next 5 years. Annual Depreciation and Amortization increases by 60 in each of the next 5 years. Capital expenditure (CapEx) will be 1,200 in each of the next 5 years. 7 8 Income Statement Assumptions: Interest and investment income is 2.5% of the ending Cash & Short-Term Investments in the previous year 10 Interest rate on debt is 5% based on the ending ST Debt & Curr. Portion LT Debt and Long-Term Debt in the previous year. 11 Tax rate is assumed to be 21%. 12 1,184 million common shares outstanding. 13 Dividend payout ratio -50% 14 15 Working Capital Assumptions 16 In the next 5 years, AR to Sales ratio remains the same as that in the most recent fiscal year (FY2017). 17 In the next 5 years, Inventory to COGS ratio remains the same as that in the most recent fiscal year (FY2017). 18 In the next 5 years, Other current assets to Sales ratio remains the same as that in the most recent fiscal year (FY2017). 19 In the next 5 years, AP to COGS ratio remains the same as that in the most recent fiscal year (FY2017). In the next 5 years, Income Tax Payable to Sales ratio remains the same as that in the most recent fiscal year (FY2017). In the next 5 years, Other current liabilities to Sales ratio remains the same as that in the most recent fiscal year (FY2017). 21 22 23 Assets Assumptions: 24 Intangible assets grows at the same rate as sales (7%) in the next 5 years 25 Deferred tax assets grows at the same rate as sales (7%) in the next 5 years 26 Other assets grows at the same rate as sales (7%) in the next 5 years 27 Deferred tax liabilities grows at the same rate as sales (7%) in the next 5 years 28 Other liabilities grows at the same rate as sales (7%) in the next 5 years 29 30 Debt Assumptions 31 Short-term debt increases by 2% in each year. 32 Long-term debt decreases by 8% each year. 33 34 35 Instructions BS IS Q1 Q2 Ready Assumptions Review View FIN200 Project_Students (1) Tell me Q3 Conditional Formatting Format as Table Cell Styles v N Q4 + 0 P Insert v Delete v Format v Q R Q- cash Share [480 TO D Sort & Find & & Filter Select Analyze Data T V 5 |18| U V Comments Sensitivity Yes W No 100% X AutoSave OFF AB2-C 2 - Home Insert Draw Page Layout Formulas Data Calibri (Body) 11 G General ( Paste BIU. A $ % 9 43 Open recovered workbooks? Your recent changes were saved. Do you want to continue working where you left off? E7 fx A B C D E F G H J K L 1. Calculate the following measures for fiscal years 2015, 2016, and 2017: (1) profit margin, (2) ROA, (3) ROE, (4) debt- to-equity ratio, (5) accounts receivable days, (6) days 1 inventory outstanding, (7) accounts payable days. 2 FY2015 FY2016 FY2017 3 Profit margin 4 ROA 8% 8.4% 8.6% 16.5% 18.5% 19.4% 111.0 % 183.6% 593.5 % 3.4 5.4 18.6 7.793247 7.8 7.1 7,009 88,519 7,957 94,595 8,530 100,904 7,009 42,549 7,957 42,966 8,530 44,529 7,009 6,316 7,957 4,333 8,630 1,454 21,315 6,316 23,601 4,333 27,028 1,454 5 ROE 6 Debt-to-equity ratio 7 Accounts receivable days 8 Days Inventory outstanding 74.0 73.5 69.9 9 Accounts payable days 41.1 41.0 39.7 10 11 12 13 14 15 16 17 18 19 20 21 22 23 24 25 26 27 28 29 30 31 BS T IS Q1 Q2 Q3 Ready Instructions Assumptions Review FIN200 Project_Students (1) Tell me View 04 Conditional Formatting Format as Table Cell Styles v M + N O Insert v Delete v Format v P Q- cash Share [80 TO LIN Sort & Find & & Analyze Data Filter Select Q R 5 T # |18| V E Comments Sensitivity Yes U No V 100% AutoSave OFF AB2-C 2 - Home Insert Draw Page Layout Formulas Data Review View Conditional Formatting G 11 General ( Calibri (Body) BIU Format as Table Paste $ % 9 43 Cell Styles v Open recovered workbooks? Your recent changes were saved. Do you want to continue working where you left off? E16 : fx A B D E F G H J 2. Create projected income statements for years 2018, 2019, 2020, 2021, and 2022 based on the historical financial statements as well as the 1 information provided in the Assumptions worksheet. FY2019 FY2020 FY2015 FY2016 FY2017 FY2018 88,519 94,595 100,904 FY2021 123,612 FY2022 132,265 4 Net sales 5 Cost of goods said -58,254 62,282 65.548 (82,820) (88,617) 6 Gross profit 30,265 32,313 34,356 40,792 43,647 Selling, general and administrative (SG&A) (21,014) (22,485) 8 Depreciation and amortization (1,991) (2,051) 9 Operating Income (EBIT) 17,787 19,111 -16,801 -17,132 -17264 -1,690 -1,754 -1,811 11,774 13,427 14,681 155 36 74 -919 -972 -1,057 11,021 12,491 13,698 10 Interest and investment income 91 97 11 Interest expense (1,408) (1,507) 12 Pre-Tax Income 16,469 13 Income taxas 4,012 4.534 -5,068 (6,209) 14 Net camnings/loss 7,009 7,957 8,630 10,260 15 16 17 18 19 20 21 22 23 24 25 26 27 28 29 30 31 32 33 34 Q2 Ready Instructions BS IS 107,967 (72,338) 35,629 (18,354) (1,871) 15,404 79 (1,230) 14,253 (5,423) 8,830 Assumptions *D/ 115,525 (77,402) 38,123 (19,639) (1,931) 16,553 85 (1,316) 15,322 (5,802) 9,520 Q1 FIN200 Project_Students (1) Tell me 17,702 (6,643) 11,059 Q3 141,523 (94,820) 46,703 (24,059) (2,111) 20,533 104 (1,612) 19,024 (7,018) 11,916 Q4 + K L NO Insert v Delete v Format v M Q- cash Share [80 TO D Sort & Find & & Analyze Data Filter Select 0 P N V # |18| L Q R Comments Sensitivity Yes 5 19 No 100% T AutoSave OFF A 2.C P .. Home Insert Draw Page Layout Formulas Data G Calibri (Body) 11 General ( Paste BI Uv A $ % 9 43 Open recovered workbooks? Your recent changes were saved. Do you want to continue working where you left off? K27 x fx fx A 8 C D E F G . H J 5 Assets Cash & Short-Term Investments 2,216 7 Short-Term Receivables 1,890 2,089 13,857 2,235 2,391 14,827 15,865 2,559 16,976 2,738 18,164 8 Inventories 9 Other Current Assets 10 Total Current Assets 11 Property and equipment, at cost 2,538 3,595 2,029 1,952 11,809 12,549 12,748 1,078 608 638 16,993 17,724 18,933 39,266 40.426 41.414 17,075 18,512 19,339 22,191 21,914 22,075 2,665 2,093 2,275 48 652 42,549 12 Accumulated depreciation and amortization 13 Net Property, Plant & Equipment 14 Intangible Assets 2,434 2,605 2,787 2,982 3,191 15 Deferred Tax Assets 127 136 146 156 167 16 Other Assets 91 119 1,144 1,127 1,206 42,966 44,529 1,290 1,381 1,477 1,581 17 Total Assets 18 19 Liabilities & Shareholders' Equity 20 ST Debt & Curr. Portion LT Debt 427 3,048 21 Accounts Payable 9,015 9,646 10,322 6,565 36 22 Income Tax Payable 7,108 23 Other Current Liabilities 5.498 Total Current Liabilities 1,252 2,761 2,816 2,873 2,930 2,989 7,000 7,244 7,874 8,425 25 54 5,423 5,802 6,209 6,643 5,856 6,135 6,564 7,024 7,516 8,042 12,526 14,133 16,194 22,678 24,124 25,669 27,320 20,888 22,349 24,267 26,208 28.305 30,569 33,015 854 296 440 471 504 539 577 1,965 1,855 2,174 2,326 2.489 2,663 2,850 36,233 38,633 43,075 51,683 55,422 59,441 8,605 29,083 35.656 25 Long-Term Debt 26 Deferred Tax Liabilities 617 27 Other Liabilities 3.049 28 Total Liabilities 63,761 68,405 29 Common Equity 6,316 4,333 1,454 30 Total Shareholders' Equity 6,316 4,333 1,454 31 Total Equity 6,316 4,333 1,454 42,549 42,966 44.529 32 Total Liabilities & Shareholders' Equity 33 34 35 36 37 38 39 Instructions BS IS Q2 03 Ready Assumptions Review View *D? FIN200 Project_Students (1) Tell me Q1 04 Conditional Formatting Format as Table Cell Styles AR to Sales ratio Inv to COGS ratio Other current asset to Sales AP to COGS ratio Income Tax Payable to Sales Other current liabilities to Sales + K Q- cash Share [480 TO D Sort & Find & Analyze Sensitivity Data & Filter Select Yes 0 Q R Insert v Delete v Format v L M N 0.019 0.192 0.188 0.109 7,244 -66,548 0.050 -5,068 100,904 0.061 6,135 100,904 9 |18| V e P Comments ***** No 100% 5 AutoSave OFF A B 2 C Home Insert Draw Page Layout Data Review Conditional Formatting Calibri (Body) G 11 General (G Format as Table Paste BIU A $ % % 9 J 43 Cell Styles Open recovered workbooks? Your recent changes were saved. Do you want to continue working where you left off? A1 fx 4. Create projected statements of cash flows based on the projected income statement and balance sheet information. A B C D E F G H J K L M 4. Create projected statements of cash flows based on the projected income statement and balance sheet information. 1 2 3 FY2018 FY2019 FY2020 FY2021 FY2022 4 Operating Activities 5 Net Income 6 Depreciation and amortization 7 Short-Term Receivables 8 Inventories 9 Other Current Assets 10 Deferred Tax Assets 11 Other Assets 12 Accounts Payable 13 Income Tax Payable 14 Other Current Liabilities 15 Deferred Tax Liabilities 16 Other Liabilities 17 Cash Flow from Operations 18 19 Investing Activities 20 Property and equipment, at cost 21 Intangible Assets 22 Cash Flow from Investments 23 24 Financing Activities 25 26 Long-Term Debt 27 Dividend Payout 28 Cash Flow From Financing 29 30 Net Increase (Decrease) in Cash 31 32 33 34 Instructions Q4 ST Debt & Curr. Portion LT Debt Ready BS IS Formulas Assumptions Q1 View FIN200 Project_Students (1) Tell me Q2 Q3 + Insert v Delete v Format v N Q- cash Share TO Y D Sort & Find & & Analyze Data V Filter Select P Q R 0 9 |18| [] Comments Sensitivity | Yes 5 441***** 33233333 44122222 T No 100% AutoSave OFF A B 2.C ? - Home Insert Draw Page Layout Formulas Data Review View Conditional Formatting G Calibri (Body) 11 General 8. Format as Table Paste BIU $ % 9 Je 43 Cell Styles v Open recovered workbooks? Your recent changes were saved. Do you want to continue working where you left off? B2 fx FIN200 Spring 2022 Project A B D E F G HI J K FIN200 Spring 2022 Project Due Date: 11:59 pm on May 1, 2022 (Sunday) ***Please email me (cshang@suffolk.edu) your completed Excel file before the deadline. Late submissions will NOT be accepted. Instructions: 1. Please save the completed Excel file under your full name (e.g., Tom Brady). 2. By submitting this project, you acknowledge that this project is completed Independently. 3. The Assumptions worksheet contains important information you may need to complete the project. Please read it carefully. 4. Please fill out all the GREEN cells in 01, 02, 03, and 04. 5. Unless you are using information from the Assumptions tab, calculated numbers should always be linked to original source cells. PLEASE NOTE THAT YOU WILL NOT EARN POINTS IF YOUR ANSWER IS HARDCODED. BS IS Assumptions Q1 Q2 Q3 Q4 1 2 3 4 5 6 7 8 9 10 11 12 13 14 15 16 17 18 19 20 21 22 23 24 25 26 27 28 29 30 31 32 33 34 35 Ready Instructions FIN200 Project_Students (1) Tell me + L DMO M Insert v Delete v Format v N Q- cash Share [80 TO D & Sort & Find & Filter Select Analyze Data V 0 P R # |18| L Q Comments Sensitivity Yes 5 No T 100% AutoSave OFF A 2.C P .. FIN200 Project_Students (1).xlsx - Group Home Insert Draw Page Layout Formulas Data Review View Tell me Conditional Formatting G Calibri (Body) 11 ( General $ % Format as Table Paste BI Uv A % 9 08 J 43 Cell Styles Open recovered workbooks? Your recent changes were saved. Do you want to continue working where you left off? B2 x fx A B D E F G H I J 1 2 Balance Sheet All figures in millions of U.S. Dollar except per share items. 4 FY2015 FY2016 FY2017 5 Assets Cash & Short-Term Investments Short-Term Receivables 8 Inventories 2,216 2,538 3,595 1,890 2,029 1,952 11,809 12,549 12,748 1,078 608 638 16,993 17,724 18,933 1945.07 1804.72 1294.3 9 Other Current Assets 10 Total Current Assets 11 Property and equipment, at cost 12 Accumulated depreciation and amortization 13 Net Property, Plant & Equipment 14 Intangible Assets 39,266 40,426 41,414 17,075 18,512 19,339 22,191 21,914 22,075 2,093 2,275 91 119 1.144 1,127 42,966 44,529 2,665 15 Deferred Tax Assets 48 16 Other Assets 652 42,549 17 Total Assets 18 19 Liabilities & Shareholders' Equity 20 ST Debt & Curr. Portion LT Debt 2,761 427 6,565 36 1,252 7,000 21 Accounts Payable 7,244 1081.33 1006.7 735.483 22 Income Tax Payable 54 6.135 23 Other Current Liabilities 5,498 24 Total Current Liabilities 25 Long-Term Debt 25 5,856 12,526 14,133 16,194 20,888 22,349 24,267 854 296 440 1,965 1,855 2,174 36,233 38,633 43,075 21,315 23,601 27,028 26 Deferred Tax Liabilities 27 Other Liabilities 28 Total Liabilities 29 Common Equity 6,316 1,454 4,333 4.333 1,454 30 Total Shareholders' Equity 31 Total Equity 6,316 6,316 4,333 1.454 42,549 42,966 44,529 32 Total Liabilities & Shareholders' Equity 33 34 35 Instructions BS Assumptions Q2 Q3 Ready IS Q1 Q4 + K L DMO Insert v Delete v Format M N *480* Sort & Find & Filter Select P V 0 |18| Q- cash [] Q Comments Share O Analyze Sensitivity Data Yes R 5 No T 100% AutoSave OFF A B 2.C ? - Home Insert Draw Page Layout Formulas Data Conditional Formatting G Calibri (Body) 11 Custom ( 8. Format as Table Paste BIU $ % 9 J 43 Cell Styles v Open recovered workbooks? Your recent changes were saved. Do you want to continue working where you left off? D5 fx 100904 A B C D E F G H I J 2 Income Statement 3 All figures in millions of U.S. Dollar except per share items. 4 5 Net sales FY2015 FY2016 FY2017 88,519 94,595 100,904 -58,254 -62,282 -66,548 6 Cost of goods sold. 7 Gross profit 30,265 32,313 34,356 -16,801 -17,132 -17,864 Selling, general and administrative (SG&A) 9 Depreciation and amortization 10 Operating income (EBIT) 11 Interest and investment income 12 Interest expense -1,690 -1.754 -1,811 11,774 13,427 14,681 166 36 74 -919 -972 -1,057 11,021 12,491 13,698 -4,012 -4,534 -5,068 7,009 7,957 8,630 13 Pre-Tax Income 14 Income taxes 15 Net earnings/loss 16 17 18 19 20 21 22 23 24 25 26 27 28 29 30 31 32 33 34 35 Assumptions Ready Instructions BS IS Review Q1 View FIN200 Project_Students (1) Tell me Q2 Q3 Q4 + K L DMO Insert v Delete v Format v M N Q- cash Share [180 O D Sort & Find & Filter Select Analyze Data & V P R 0 |18| [] Q Comments Sensitivity Yes 5 No T 100% AutoSave OFF A B 2.C ? - Home Insert Draw Page Layout Formulas Data G Calibri (Body) 11 General ( 8. Paste BIU A $ % 9 43 Open recovered workbooks? Your recent changes were saved. Do you want to continue working where you left off? 112 x fx A B C D E F G H J K L M 1 Operating Assumptions: 2 Sales will grow at 7% per year in the next 5 years. 3 Cost of sales will be 67% of total sales in the next 5 years. SG&A will be 17% of total sales in the next 5 years. Annual Depreciation and Amortization increases by 60 in each of the next 5 years. Capital expenditure (CapEx) will be 1,200 in each of the next 5 years. 7 8 Income Statement Assumptions: Interest and investment income is 2.5% of the ending Cash & Short-Term Investments in the previous year 10 Interest rate on debt is 5% based on the ending ST Debt & Curr. Portion LT Debt and Long-Term Debt in the previous year. 11 Tax rate is assumed to be 21%. 12 1,184 million common shares outstanding. 13 Dividend payout ratio -50% 14 15 Working Capital Assumptions 16 In the next 5 years, AR to Sales ratio remains the same as that in the most recent fiscal year (FY2017). 17 In the next 5 years, Inventory to COGS ratio remains the same as that in the most recent fiscal year (FY2017). 18 In the next 5 years, Other current assets to Sales ratio remains the same as that in the most recent fiscal year (FY2017). 19 In the next 5 years, AP to COGS ratio remains the same as that in the most recent fiscal year (FY2017). In the next 5 years, Income Tax Payable to Sales ratio remains the same as that in the most recent fiscal year (FY2017). In the next 5 years, Other current liabilities to Sales ratio remains the same as that in the most recent fiscal year (FY2017). 21 22 23 Assets Assumptions: 24 Intangible assets grows at the same rate as sales (7%) in the next 5 years 25 Deferred tax assets grows at the same rate as sales (7%) in the next 5 years 26 Other assets grows at the same rate as sales (7%) in the next 5 years 27 Deferred tax liabilities grows at the same rate as sales (7%) in the next 5 years 28 Other liabilities grows at the same rate as sales (7%) in the next 5 years 29 30 Debt Assumptions 31 Short-term debt increases by 2% in each year. 32 Long-term debt decreases by 8% each year. 33 34 35 Instructions BS IS Q1 Q2 Ready Assumptions Review View FIN200 Project_Students (1) Tell me Q3 Conditional Formatting Format as Table Cell Styles v N Q4 + 0 P Insert v Delete v Format v Q R Q- cash Share [480 TO D Sort & Find & & Filter Select Analyze Data T V 5 |18| U V Comments Sensitivity Yes W No 100% X AutoSave OFF AB2-C 2 - Home Insert Draw Page Layout Formulas Data Calibri (Body) 11 G General ( Paste BIU. A $ % 9 43 Open recovered workbooks? Your recent changes were saved. Do you want to continue working where you left off? E7 fx A B C D E F G H J K L 1. Calculate the following measures for fiscal years 2015, 2016, and 2017: (1) profit margin, (2) ROA, (3) ROE, (4) debt- to-equity ratio, (5) accounts receivable days, (6) days 1 inventory outstanding, (7) accounts payable days. 2 FY2015 FY2016 FY2017 3 Profit margin 4 ROA 8% 8.4% 8.6% 16.5% 18.5% 19.4% 111.0 % 183.6% 593.5 % 3.4 5.4 18.6 7.793247 7.8 7.1 7,009 88,519 7,957 94,595 8,530 100,904 7,009 42,549 7,957 42,966 8,530 44,529 7,009 6,316 7,957 4,333 8,630 1,454 21,315 6,316 23,601 4,333 27,028 1,454 5 ROE 6 Debt-to-equity ratio 7 Accounts receivable days 8 Days Inventory outstanding 74.0 73.5 69.9 9 Accounts payable days 41.1 41.0 39.7 10 11 12 13 14 15 16 17 18 19 20 21 22 23 24 25 26 27 28 29 30 31 BS T IS Q1 Q2 Q3 Ready Instructions Assumptions Review FIN200 Project_Students (1) Tell me View 04 Conditional Formatting Format as Table Cell Styles v M + N O Insert v Delete v Format v P Q- cash Share [80 TO LIN Sort & Find & & Analyze Data Filter Select Q R 5 T # |18| V E Comments Sensitivity Yes U No V 100% AutoSave OFF AB2-C 2 - Home Insert Draw Page Layout Formulas Data Review View Conditional Formatting G 11 General ( Calibri (Body) BIU Format as Table Paste $ % 9 43 Cell Styles v Open recovered workbooks? Your recent changes were saved. Do you want to continue working where you left off? E16 : fx A B D E F G H J 2. Create projected income statements for years 2018, 2019, 2020, 2021, and 2022 based on the historical financial statements as well as the 1 information provided in the Assumptions worksheet. FY2019 FY2020 FY2015 FY2016 FY2017 FY2018 88,519 94,595 100,904 FY2021 123,612 FY2022 132,265 4 Net sales 5 Cost of goods said -58,254 62,282 65.548 (82,820) (88,617) 6 Gross profit 30,265 32,313 34,356 40,792 43,647 Selling, general and administrative (SG&A) (21,014) (22,485) 8 Depreciation and amortization (1,991) (2,051) 9 Operating Income (EBIT) 17,787 19,111 -16,801 -17,132 -17264 -1,690 -1,754 -1,811 11,774 13,427 14,681 155 36 74 -919 -972 -1,057 11,021 12,491 13,698 10 Interest and investment income 91 97 11 Interest expense (1,408) (1,507) 12 Pre-Tax Income 16,469 13 Income taxas 4,012 4.534 -5,068 (6,209) 14 Net camnings/loss 7,009 7,957 8,630 10,260 15 16 17 18 19 20 21 22 23 24 25 26 27 28 29 30 31 32 33 34 Q2 Ready Instructions BS IS 107,967 (72,338) 35,629 (18,354) (1,871) 15,404 79 (1,230) 14,253 (5,423) 8,830 Assumptions *D/ 115,525 (77,402) 38,123 (19,639) (1,931) 16,553 85 (1,316) 15,322 (5,802) 9,520 Q1 FIN200 Project_Students (1) Tell me 17,702 (6,643) 11,059 Q3 141,523 (94,820) 46,703 (24,059) (2,111) 20,533 104 (1,612) 19,024 (7,018) 11,916 Q4 + K L NO Insert v Delete v Format v M Q- cash Share [80 TO D Sort & Find & & Analyze Data Filter Select 0 P N V # |18| L Q R Comments Sensitivity Yes 5 19 No 100% T AutoSave OFF A 2.C P .. Home Insert Draw Page Layout Formulas Data G Calibri (Body) 11 General ( Paste BI Uv A $ % 9 43 Open recovered workbooks? Your recent changes were saved. Do you want to continue working where you left off? K27 x fx fx A 8 C D E F G . H J 5 Assets Cash & Short-Term Investments 2,216 7 Short-Term Receivables 1,890 2,089 13,857 2,235 2,391 14,827 15,865 2,559 16,976 2,738 18,164 8 Inventories 9 Other Current Assets 10 Total Current Assets 11 Property and equipment, at cost 2,538 3,595 2,029 1,952 11,809 12,549 12,748 1,078 608 638 16,993 17,724 18,933 39,266 40.426 41.414 17,075 18,512 19,339 22,191 21,914 22,075 2,665 2,093 2,275 48 652 42,549 12 Accumulated depreciation and amortization 13 Net Property, Plant & Equipment 14 Intangible Assets 2,434 2,605 2,787 2,982 3,191 15 Deferred Tax Assets 127 136 146 156 167 16 Other Assets 91 119 1,144 1,127 1,206 42,966 44,529 1,290 1,381 1,477 1,581 17 Total Assets 18 19 Liabilities & Shareholders' Equity 20 ST Debt & Curr. Portion LT Debt 427 3,048 21 Accounts Payable 9,015 9,646 10,322 6,565 36 22 Income Tax Payable 7,108 23 Other Current Liabilities 5.498 Total Current Liabilities 1,252 2,761 2,816 2,873 2,930 2,989 7,000 7,244 7,874 8,425 25 54 5,423 5,802 6,209 6,643 5,856 6,135 6,564 7,024 7,516 8,042 12,526 14,133 16,194 22,678 24,124 25,669 27,320 20,888 22,349 24,267 26,208 28.305 30,569 33,015 854 296 440 471 504 539 577 1,965 1,855 2,174 2,326 2.489 2,663 2,850 36,233 38,633 43,075 51,683 55,422 59,441 8,605 29,083 35.656 25 Long-Term Debt 26 Deferred Tax Liabilities 617 27 Other Liabilities 3.049 28 Total Liabilities 63,761 68,405 29 Common Equity 6,316 4,333 1,454 30 Total Shareholders' Equity 6,316 4,333 1,454 31 Total Equity 6,316 4,333 1,454 42,549 42,966 44.529 32 Total Liabilities & Shareholders' Equity 33 34 35 36 37 38 39 Instructions BS IS Q2 03 Ready Assumptions Review View *D? FIN200 Project_Students (1) Tell me Q1 04 Conditional Formatting Format as Table Cell Styles AR to Sales ratio Inv to COGS ratio Other current asset to Sales AP to COGS ratio Income Tax Payable to Sales Other current liabilities to Sales + K Q- cash Share [480 TO D Sort & Find & Analyze Sensitivity Data & Filter Select Yes 0 Q R Insert v Delete v Format v L M N 0.019 0.192 0.188 0.109 7,244 -66,548 0.050 -5,068 100,904 0.061 6,135 100,904 9 |18| V e P Comments ***** No 100% 5 AutoSave OFF A B 2 C Home Insert Draw Page Layout Data Review Conditional Formatting Calibri (Body) G 11 General (G Format as Table Paste BIU A $ % % 9 J 43 Cell Styles Open recovered workbooks? Your recent changes were saved. Do you want to continue working where you left off? A1 fx 4. Create projected statements of cash flows based on the projected income statement and balance sheet information. A B C D E F G H J K L M 4. Create projected statements of cash flows based on the projected income statement and balance sheet information. 1 2 3 FY2018 FY2019 FY2020 FY2021 FY2022 4 Operating Activities 5 Net Income 6 Depreciation and amortization 7 Short-Term Receivables 8 Inventories 9 Other Current Assets 10 Deferred Tax Assets 11 Other Assets 12 Accounts Payable 13 Income Tax Payable 14 Other Current Liabilities 15 Deferred Tax Liabilities 16 Other Liabilities 17 Cash Flow from Operations 18 19 Investing Activities 20 Property and equipment, at cost 21 Intangible Assets 22 Cash Flow from Investments 23 24 Financing Activities 25 26 Long-Term Debt 27 Dividend Payout 28 Cash Flow From Financing 29 30 Net Increase (Decrease) in Cash 31 32 33 34 Instructions Q4 ST Debt & Curr. Portion LT Debt Ready BS IS Formulas Assumptions Q1 View FIN200 Project_Students (1) Tell me Q2 Q3 + Insert v Delete v Format v N Q- cash Share TO Y D Sort & Find & & Analyze Data V Filter Select P Q R 0 9 |18| [] Comments Sensitivity | Yes 5 441***** 33233333 44122222 T No 100%
Step by Step Solution
There are 3 Steps involved in it

Get step-by-step solutions from verified subject matter experts