

Question: i can only send puctures for the excel soreadsheet because it does not ket me send the spreadsheet itself Excel's PivotTable Report provides an excellent
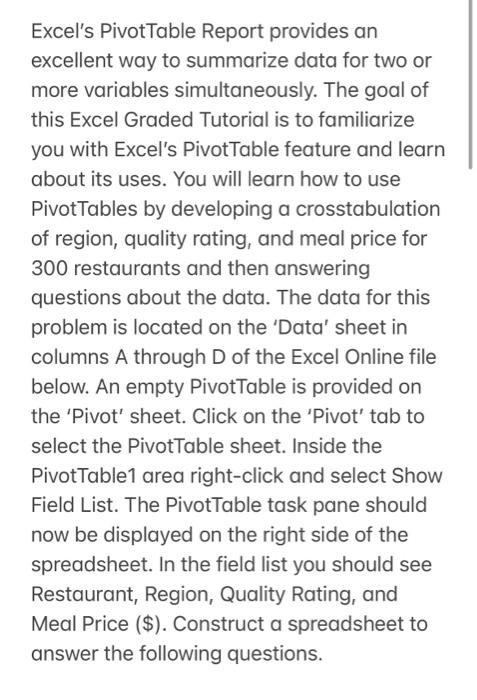
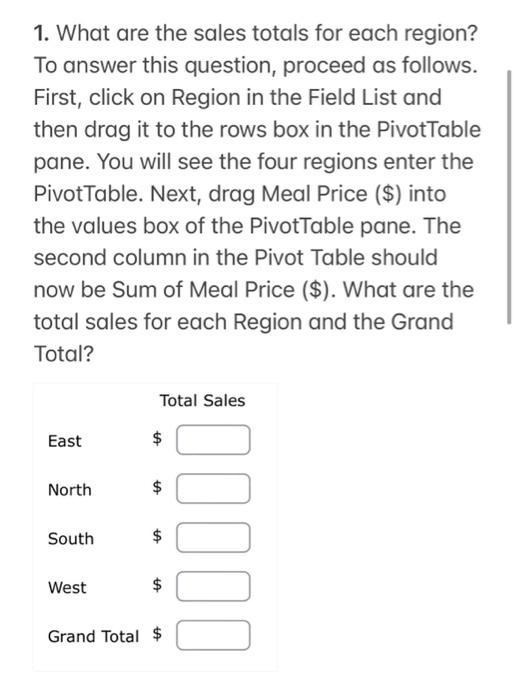
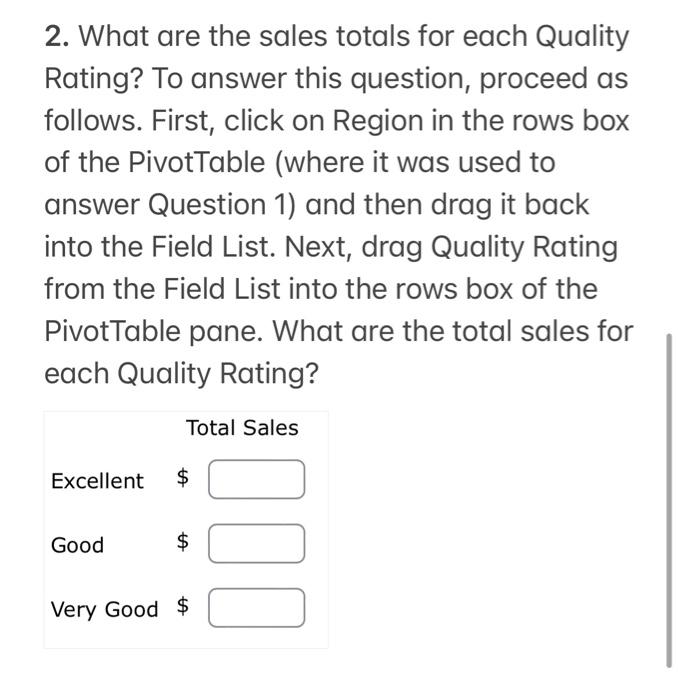
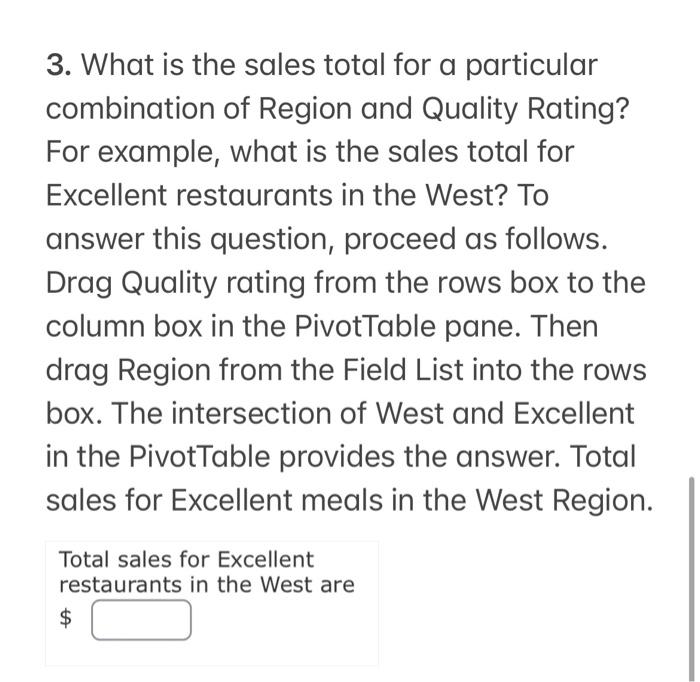
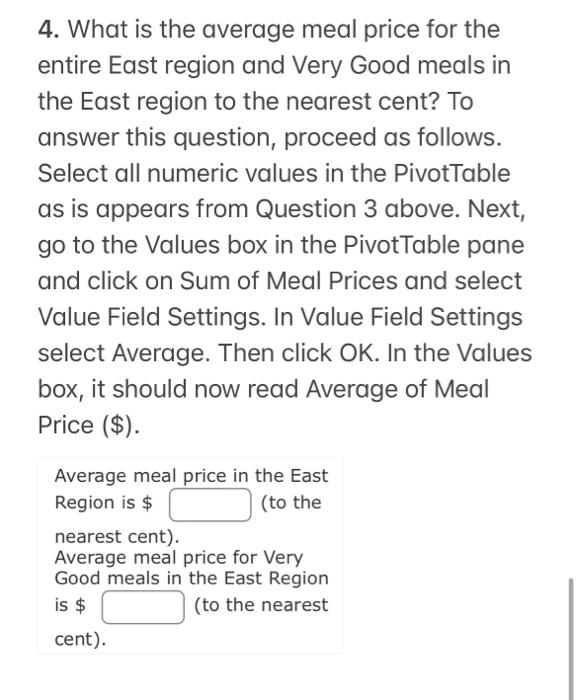
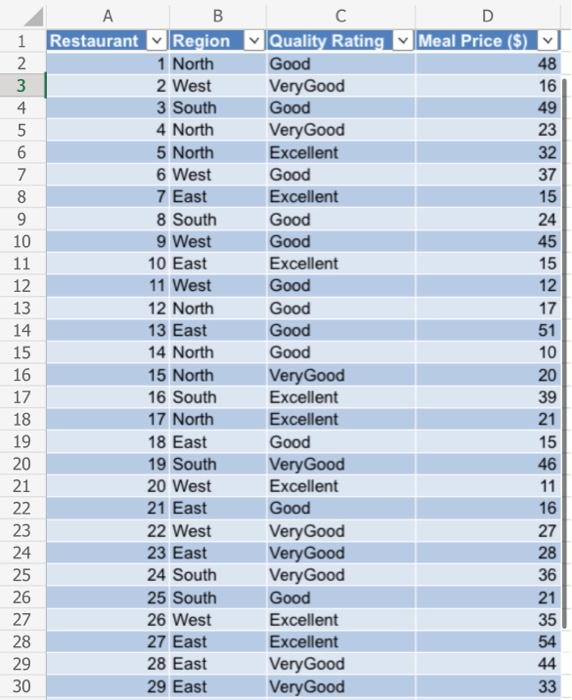
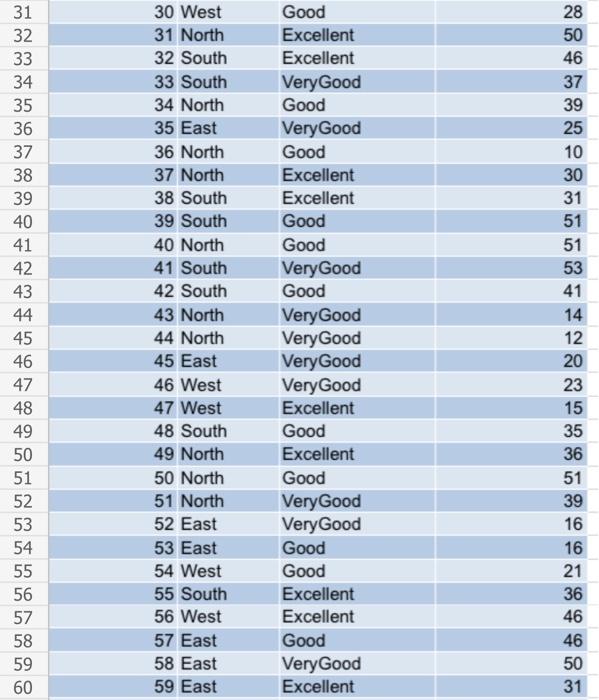
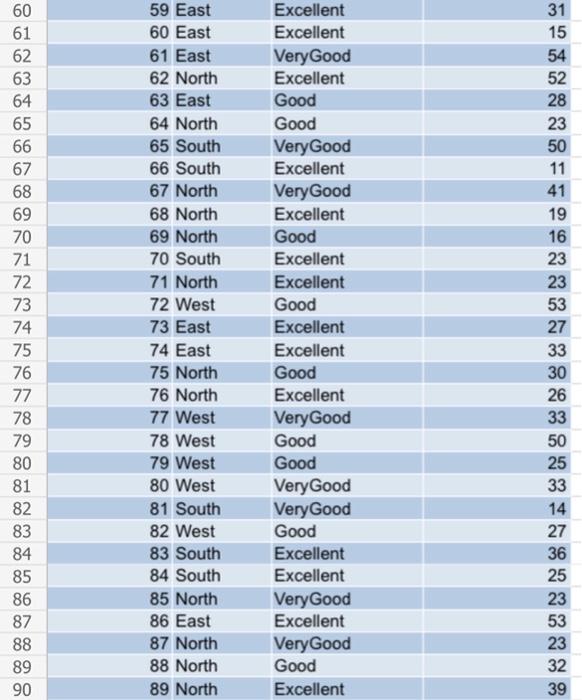
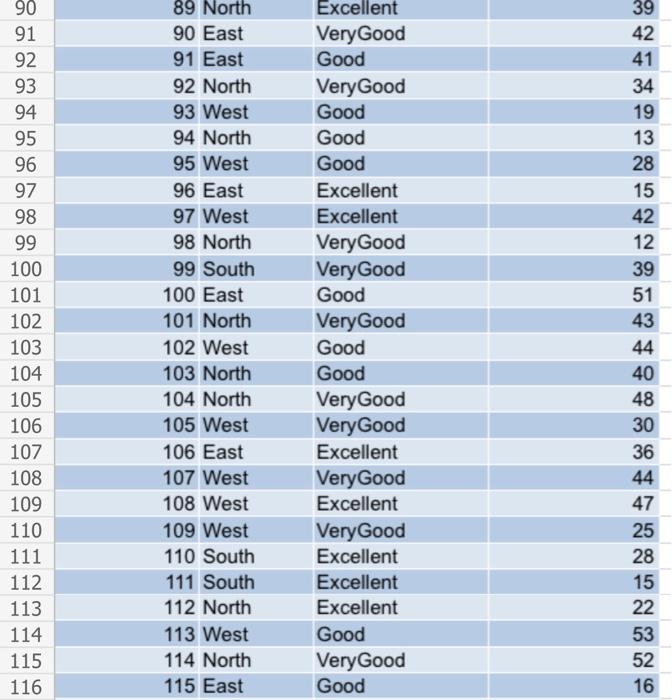
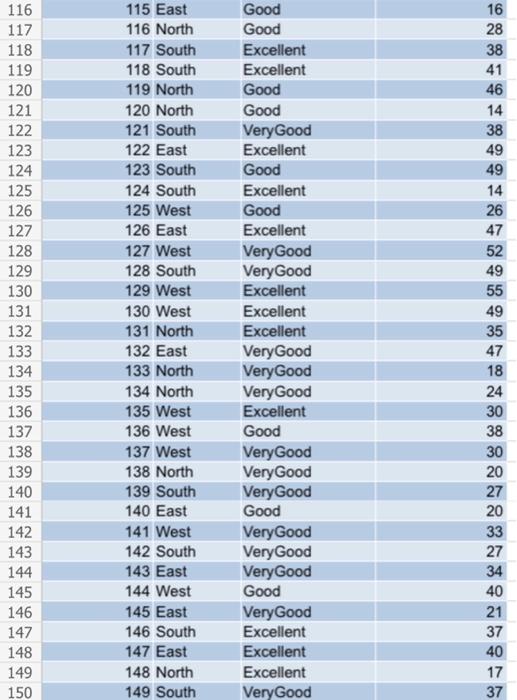
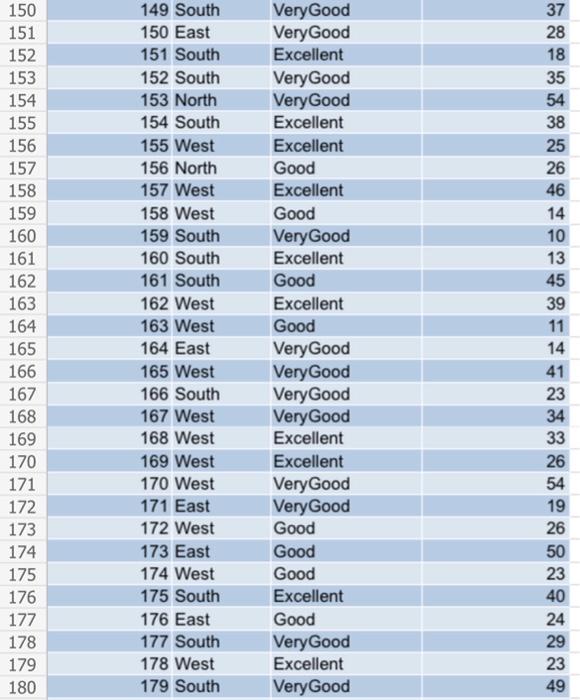
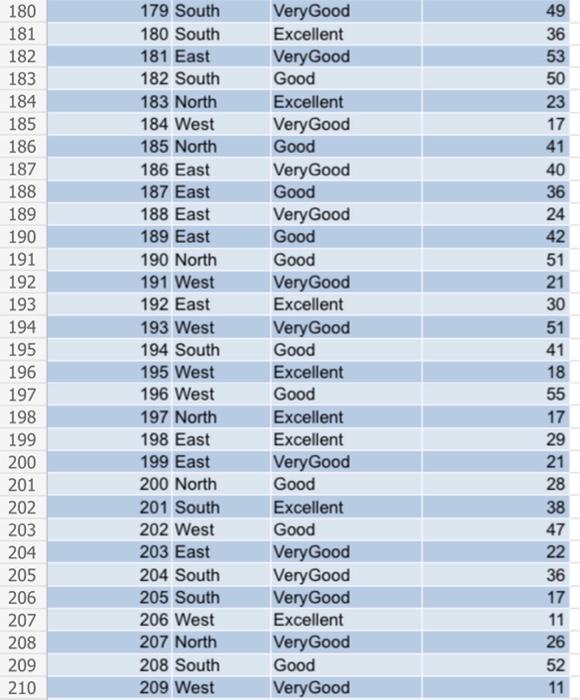
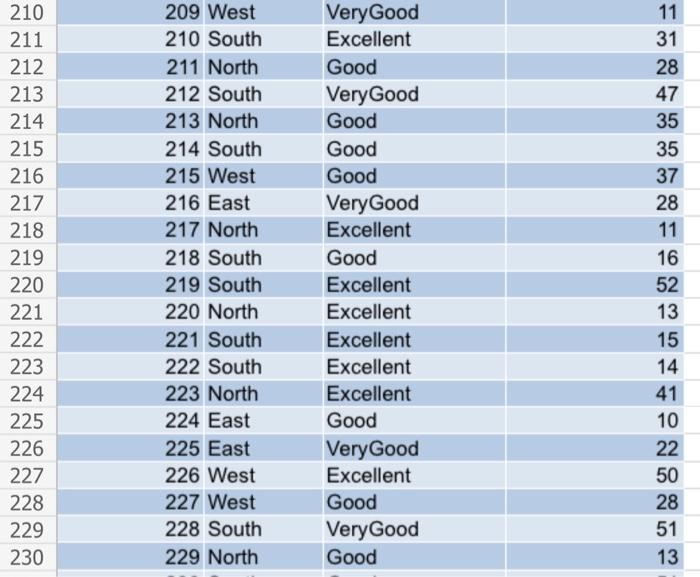
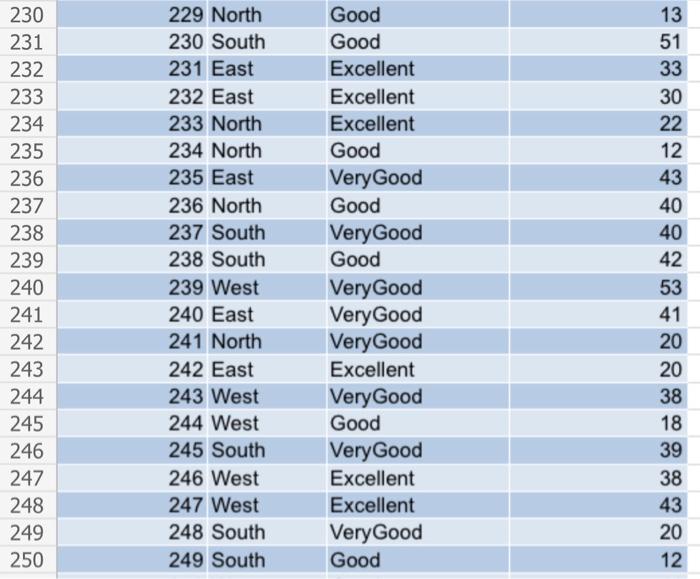
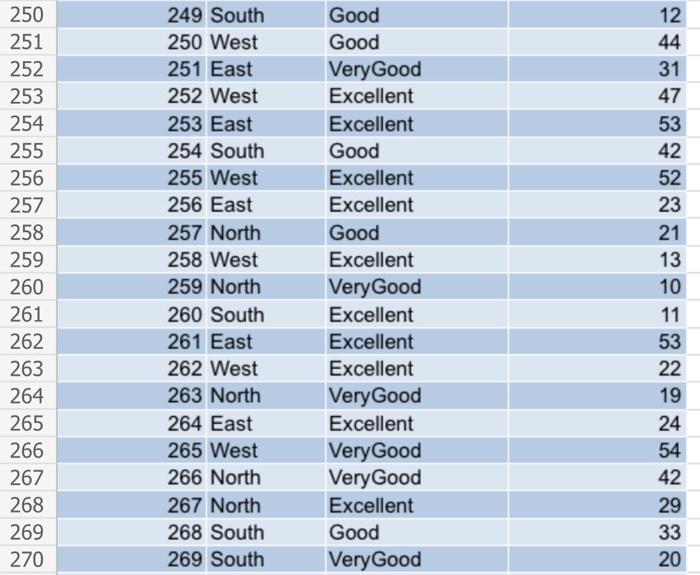
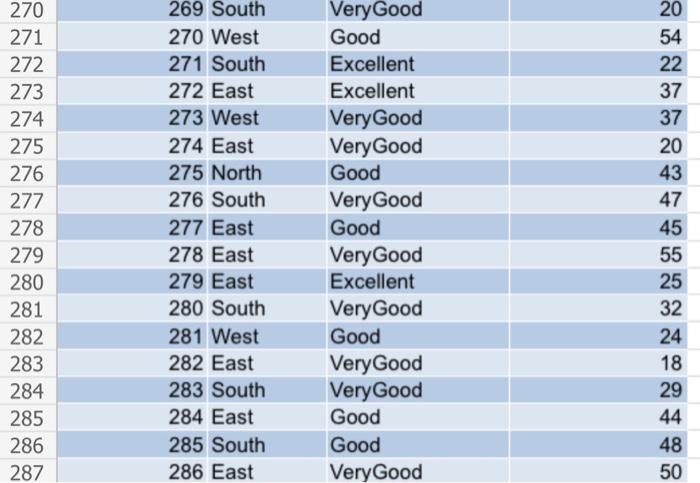
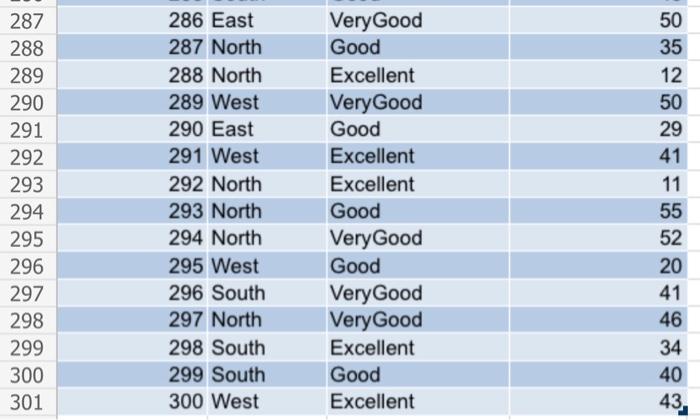
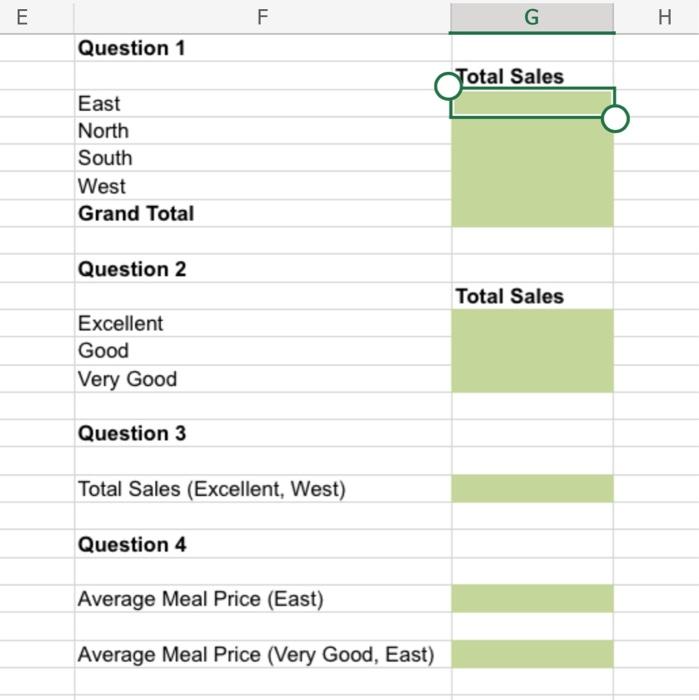
Excel's PivotTable Report provides an excellent way to summarize data for two or more variables simultaneously. The goal of this Excel Graded Tutorial is to familiarize you with Excel's PivotTable feature and learn about its uses. You will learn how to use PivotTables by developing a crosstabulation of region, quality rating, and meal price for 300 restaurants and then answering questions about the data. The data for this problem is located on the 'Data' sheet in columns A through D of the Excel Online file below. An empty PivotTable is provided on the 'Pivot' sheet. Click on the 'Pivot' tab to select the PivotTable sheet. Inside the PivotTable1 area right-click and select Show Field List. The PivotTable task pane should now be displayed on the right side of the spreadsheet. In the field list you should see Restaurant, Region, Quality Rating, and Meal Price (\$). Construct a spreadsheet to answer the following questions. 1. What are the sales totals for each region? To answer this question, proceed as follows. First, click on Region in the Field List and then drag it to the rows box in the PivotTable pane. You will see the four regions enter the PivotTable. Next, drag Meal Price (\$) into the values box of the PivotTable pane. The second column in the Pivot Table should now be Sum of Meal Price (\$). What are the total sales for each Region and the Grand Total? 2. What are the sales totals for each Quality Rating? To answer this question, proceed as follows. First, click on Region in the rows box of the PivotTable (where it was used to answer Question 1) and then drag it back into the Field List. Next, drag Quality Rating from the Field List into the rows box of the PivotTable pane. What are the total sales for each Quality Rating? 3. What is the sales total for a particular combination of Region and Quality Rating? For example, what is the sales total for Excellent restaurants in the West? To answer this question, proceed as follows. Drag Quality rating from the rows box to the column box in the PivotTable pane. Then drag Region from the Field List into the rows box. The intersection of West and Excellent in the PivotTable provides the answer. Total sales for Excellent meals in the West Region. Total sales for Excellent restaurants in the West are $ 4. What is the average meal price for the entire East region and Very Good meals in the East region to the nearest cent? To answer this question, proceed as follows. Select all numeric values in the PivotTable as is appears from Question 3 above. Next, go to the Values box in the PivotTable pane and click on Sum of Meal Prices and select Value Field Settings. In Value Field Settings select Average. Then click OK. In the Values box, it should now read Average of Meal Price (\$). Average meal price in the East Region is $ (to the nearest cent). Average meal price for Very Good meals in the East Region is \$ (to the nearest \begin{tabular}{|c|c|l|r|} \hline 90 & 90 East & VeryGood & 42 \\ \hline 91 & 91 East & Good & 41 \\ \hline 92 & 92 North & VeryGood & 34 \\ \hline 93 & 93 West & Good & 19 \\ \hline 94 & 94 North & Good & 13 \\ \hline 95 & 95 West & Good & 28 \\ \hline 96 & 96 East & Excellent & 15 \\ \hline 97 & 97 West & Excellent & 42 \\ \hline 98 & 98 North & VeryGood & 12 \\ \hline 99 & 99 South & VeryGood & 39 \\ \hline 100 & 100 East & Good & 51 \\ \hline 101 & 101 North & VeryGood & 43 \\ \hline 102 & 102 West & Good & 44 \\ \hline 103 & 103 North & Good & 40 \\ \hline 104 & 104 North & VeryGood & 48 \\ \hline 105 & 105 West & VeryGood & 30 \\ \hline 106 & 106 East & Excellent & 36 \\ \hline 107 & 107 West & VeryGood & 44 \\ \hline 108 & 108 West & Excellent & 47 \\ \hline 109 & 109 West & VeryGood & 25 \\ \hline 110 & 110 South & Excellent & 28 \\ \hline 111 & 111 South & Excellent & 15 \\ \hline 112 & 112 North & Excellent & 22 \\ \hline 113 & 113 West & Good & 53 \\ \hline 114 & 114 North & VeryGood & 52 \\ \hline 115 & 115 East & Good & 16 \\ \hline 116 & \end{tabular} \begin{tabular}{|l|l|l|l|} \hline 210 & 209 West & VeryGood & 11 \\ \hline 211 & 210 South & Excellent & 31 \\ \hline 212 & 211 North & Good & 28 \\ \hline 213 & 212 South & VeryGood & 47 \\ \hline 214 & 213 North & Good & 35 \\ \hline 215 & 214 South & Good & 35 \\ \hline 216 & 215 West & Good & 37 \\ \hline 217 & 216 East & VeryGood & 28 \\ \hline 218 & 217 North & Excellent & 11 \\ \hline 219 & 218 South & Good & 16 \\ \hline 220 & 219 South & Excellent & 52 \\ \hline 221 & 220 North & Excellent & 13 \\ \hline 222 & 221 South & Excellent & 15 \\ \hline 223 & 222 South & Excellent & 14 \\ \hline 224 & 223 North & Excellent & 41 \\ \hline 225 & 224 East & Good & 10 \\ \hline 226 & 225 East & VeryGood & 22 \\ \hline 227 & 226 West & Excellent & 50 \\ \hline 228 & 227 West & Good & 28 \\ \hline 229 & 228 South & VeryGood & 51 \\ \hline 230 & 229 North & Good & 13 \\ \hline \end{tabular} \begin{tabular}{|l|l|l|l|} \hline 230 & 229 North & Good & 13 \\ \hline 231 & 230 South & Good & 51 \\ \hline 232 & 231 East & Excellent & 33 \\ \hline 233 & 232 East & Excellent & 30 \\ \hline 234 & 233 North & Excellent & 22 \\ \hline 235 & 234 North & Good & 12 \\ \hline 236 & 235 East & VeryGood & 43 \\ \hline 237 & 236 North & Good & 40 \\ \hline 238 & 237 South & VeryGood & 40 \\ \hline 239 & 238 South & Good & 42 \\ \hline 240 & 239 West & VeryGood & 53 \\ \hline 241 & 240 East & VeryGood & 41 \\ \hline 242 & 241 North & VeryGood & 20 \\ \hline 243 & 242 East & Excellent & 20 \\ \hline 244 & 243 West & VeryGood & 38 \\ \hline 245 & 244 West & Good & 18 \\ \hline 246 & 245 South & VeryGood & 39 \\ \hline 247 & 246 West & Excellent & 38 \\ \hline 248 & 247 West & Excellent & 43 \\ \hline 249 & 248 South & VeryGood & 20 \\ \hline 250 & 249 South & Good & 12 \\ \hline \end{tabular} \begin{tabular}{|l|l|l|l|} \hline 250 & 249 South & Good & 12 \\ \hline 251 & 250 West & Good & 44 \\ \hline 252 & 251 East & VeryGood & 31 \\ \hline 253 & 252 West & Excellent & 47 \\ \hline 254 & 253 East & Excellent & 53 \\ \hline 255 & 254 South & Good & 42 \\ \hline 256 & 255 West & Excellent & 52 \\ \hline 257 & 256 East & Excellent & 23 \\ \hline 258 & 257 North & Good & 21 \\ \hline 259 & 258 West & Excellent & 13 \\ \hline 260 & 259 North & VeryGood & 10 \\ \hline 261 & 260 South & Excellent & 11 \\ \hline 262 & 261 East & Excellent & 53 \\ \hline 263 & 262 West & Excellent & 22 \\ \hline 264 & 263 North & VeryGood & 19 \\ \hline 265 & 264 East & Excellent & 24 \\ \hline 266 & 265 West & VeryGood & 54 \\ \hline 267 & 266 North & VeryGood & 42 \\ \hline 268 & 267 North & Excellent & 29 \\ \hline 269 & 268 South & Good & 33 \\ \hline 270 & 269 South & VeryGood & 20 \\ \hline \end{tabular} \begin{tabular}{|l|l|l|l|} \hline 287 & 286 East & VeryGood & 50 \\ \hline 288 & 287 North & Good & 35 \\ \hline 289 & 288 North & Excellent & 12 \\ \hline 290 & 289 West & VeryGood & 50 \\ \hline 291 & 290 East & Good & 29 \\ \hline 292 & 291 West & Excellent & 41 \\ \hline 293 & 292 North & Excellent & 11 \\ \hline 294 & 293 North & Good & 55 \\ \hline 295 & 294 North & VeryGood & 52 \\ \hline 296 & 295 West & Good & 20 \\ \hline 297 & 296 South & VeryGood & 41 \\ \hline 298 & 297 North & VeryGood & 46 \\ \hline 299 & 298 South & Excellent & 34 \\ \hline 300 & 299 South & Good & 40 \\ \hline 301 & 300 West & Excellent & 43 \\ \hline \end{tabular} \begin{tabular}{ll} E & F \\ \hline Question 1 & G \\ \hline North \\ South \\ West \\ Grand Total \\ Question 2 \\ \hline Excellent \\ \hline Good & Total Sales \\ \hline Very Good & \\ \hline \end{tabular} Question 3 Total Sales (Excellent, West) Question 4 Average Meal Price (East) Average Meal Price (Very Good, East) Excel's PivotTable Report provides an excellent way to summarize data for two or more variables simultaneously. The goal of this Excel Graded Tutorial is to familiarize you with Excel's PivotTable feature and learn about its uses. You will learn how to use PivotTables by developing a crosstabulation of region, quality rating, and meal price for 300 restaurants and then answering questions about the data. The data for this problem is located on the 'Data' sheet in columns A through D of the Excel Online file below. An empty PivotTable is provided on the 'Pivot' sheet. Click on the 'Pivot' tab to select the PivotTable sheet. Inside the PivotTable1 area right-click and select Show Field List. The PivotTable task pane should now be displayed on the right side of the spreadsheet. In the field list you should see Restaurant, Region, Quality Rating, and Meal Price (\$). Construct a spreadsheet to answer the following questions. 1. What are the sales totals for each region? To answer this question, proceed as follows. First, click on Region in the Field List and then drag it to the rows box in the PivotTable pane. You will see the four regions enter the PivotTable. Next, drag Meal Price (\$) into the values box of the PivotTable pane. The second column in the Pivot Table should now be Sum of Meal Price (\$). What are the total sales for each Region and the Grand Total? 2. What are the sales totals for each Quality Rating? To answer this question, proceed as follows. First, click on Region in the rows box of the PivotTable (where it was used to answer Question 1) and then drag it back into the Field List. Next, drag Quality Rating from the Field List into the rows box of the PivotTable pane. What are the total sales for each Quality Rating? 3. What is the sales total for a particular combination of Region and Quality Rating? For example, what is the sales total for Excellent restaurants in the West? To answer this question, proceed as follows. Drag Quality rating from the rows box to the column box in the PivotTable pane. Then drag Region from the Field List into the rows box. The intersection of West and Excellent in the PivotTable provides the answer. Total sales for Excellent meals in the West Region. Total sales for Excellent restaurants in the West are $ 4. What is the average meal price for the entire East region and Very Good meals in the East region to the nearest cent? To answer this question, proceed as follows. Select all numeric values in the PivotTable as is appears from Question 3 above. Next, go to the Values box in the PivotTable pane and click on Sum of Meal Prices and select Value Field Settings. In Value Field Settings select Average. Then click OK. In the Values box, it should now read Average of Meal Price (\$). Average meal price in the East Region is $ (to the nearest cent). Average meal price for Very Good meals in the East Region is \$ (to the nearest \begin{tabular}{|c|c|l|r|} \hline 90 & 90 East & VeryGood & 42 \\ \hline 91 & 91 East & Good & 41 \\ \hline 92 & 92 North & VeryGood & 34 \\ \hline 93 & 93 West & Good & 19 \\ \hline 94 & 94 North & Good & 13 \\ \hline 95 & 95 West & Good & 28 \\ \hline 96 & 96 East & Excellent & 15 \\ \hline 97 & 97 West & Excellent & 42 \\ \hline 98 & 98 North & VeryGood & 12 \\ \hline 99 & 99 South & VeryGood & 39 \\ \hline 100 & 100 East & Good & 51 \\ \hline 101 & 101 North & VeryGood & 43 \\ \hline 102 & 102 West & Good & 44 \\ \hline 103 & 103 North & Good & 40 \\ \hline 104 & 104 North & VeryGood & 48 \\ \hline 105 & 105 West & VeryGood & 30 \\ \hline 106 & 106 East & Excellent & 36 \\ \hline 107 & 107 West & VeryGood & 44 \\ \hline 108 & 108 West & Excellent & 47 \\ \hline 109 & 109 West & VeryGood & 25 \\ \hline 110 & 110 South & Excellent & 28 \\ \hline 111 & 111 South & Excellent & 15 \\ \hline 112 & 112 North & Excellent & 22 \\ \hline 113 & 113 West & Good & 53 \\ \hline 114 & 114 North & VeryGood & 52 \\ \hline 115 & 115 East & Good & 16 \\ \hline 116 & \end{tabular} \begin{tabular}{|l|l|l|l|} \hline 210 & 209 West & VeryGood & 11 \\ \hline 211 & 210 South & Excellent & 31 \\ \hline 212 & 211 North & Good & 28 \\ \hline 213 & 212 South & VeryGood & 47 \\ \hline 214 & 213 North & Good & 35 \\ \hline 215 & 214 South & Good & 35 \\ \hline 216 & 215 West & Good & 37 \\ \hline 217 & 216 East & VeryGood & 28 \\ \hline 218 & 217 North & Excellent & 11 \\ \hline 219 & 218 South & Good & 16 \\ \hline 220 & 219 South & Excellent & 52 \\ \hline 221 & 220 North & Excellent & 13 \\ \hline 222 & 221 South & Excellent & 15 \\ \hline 223 & 222 South & Excellent & 14 \\ \hline 224 & 223 North & Excellent & 41 \\ \hline 225 & 224 East & Good & 10 \\ \hline 226 & 225 East & VeryGood & 22 \\ \hline 227 & 226 West & Excellent & 50 \\ \hline 228 & 227 West & Good & 28 \\ \hline 229 & 228 South & VeryGood & 51 \\ \hline 230 & 229 North & Good & 13 \\ \hline \end{tabular} \begin{tabular}{|l|l|l|l|} \hline 230 & 229 North & Good & 13 \\ \hline 231 & 230 South & Good & 51 \\ \hline 232 & 231 East & Excellent & 33 \\ \hline 233 & 232 East & Excellent & 30 \\ \hline 234 & 233 North & Excellent & 22 \\ \hline 235 & 234 North & Good & 12 \\ \hline 236 & 235 East & VeryGood & 43 \\ \hline 237 & 236 North & Good & 40 \\ \hline 238 & 237 South & VeryGood & 40 \\ \hline 239 & 238 South & Good & 42 \\ \hline 240 & 239 West & VeryGood & 53 \\ \hline 241 & 240 East & VeryGood & 41 \\ \hline 242 & 241 North & VeryGood & 20 \\ \hline 243 & 242 East & Excellent & 20 \\ \hline 244 & 243 West & VeryGood & 38 \\ \hline 245 & 244 West & Good & 18 \\ \hline 246 & 245 South & VeryGood & 39 \\ \hline 247 & 246 West & Excellent & 38 \\ \hline 248 & 247 West & Excellent & 43 \\ \hline 249 & 248 South & VeryGood & 20 \\ \hline 250 & 249 South & Good & 12 \\ \hline \end{tabular} \begin{tabular}{|l|l|l|l|} \hline 250 & 249 South & Good & 12 \\ \hline 251 & 250 West & Good & 44 \\ \hline 252 & 251 East & VeryGood & 31 \\ \hline 253 & 252 West & Excellent & 47 \\ \hline 254 & 253 East & Excellent & 53 \\ \hline 255 & 254 South & Good & 42 \\ \hline 256 & 255 West & Excellent & 52 \\ \hline 257 & 256 East & Excellent & 23 \\ \hline 258 & 257 North & Good & 21 \\ \hline 259 & 258 West & Excellent & 13 \\ \hline 260 & 259 North & VeryGood & 10 \\ \hline 261 & 260 South & Excellent & 11 \\ \hline 262 & 261 East & Excellent & 53 \\ \hline 263 & 262 West & Excellent & 22 \\ \hline 264 & 263 North & VeryGood & 19 \\ \hline 265 & 264 East & Excellent & 24 \\ \hline 266 & 265 West & VeryGood & 54 \\ \hline 267 & 266 North & VeryGood & 42 \\ \hline 268 & 267 North & Excellent & 29 \\ \hline 269 & 268 South & Good & 33 \\ \hline 270 & 269 South & VeryGood & 20 \\ \hline \end{tabular} \begin{tabular}{|l|l|l|l|} \hline 287 & 286 East & VeryGood & 50 \\ \hline 288 & 287 North & Good & 35 \\ \hline 289 & 288 North & Excellent & 12 \\ \hline 290 & 289 West & VeryGood & 50 \\ \hline 291 & 290 East & Good & 29 \\ \hline 292 & 291 West & Excellent & 41 \\ \hline 293 & 292 North & Excellent & 11 \\ \hline 294 & 293 North & Good & 55 \\ \hline 295 & 294 North & VeryGood & 52 \\ \hline 296 & 295 West & Good & 20 \\ \hline 297 & 296 South & VeryGood & 41 \\ \hline 298 & 297 North & VeryGood & 46 \\ \hline 299 & 298 South & Excellent & 34 \\ \hline 300 & 299 South & Good & 40 \\ \hline 301 & 300 West & Excellent & 43 \\ \hline \end{tabular} \begin{tabular}{ll} E & F \\ \hline Question 1 & G \\ \hline North \\ South \\ West \\ Grand Total \\ Question 2 \\ \hline Excellent \\ \hline Good & Total Sales \\ \hline Very Good & \\ \hline \end{tabular} Question 3 Total Sales (Excellent, West) Question 4 Average Meal Price (East) Average Meal Price (Very Good, East)
Step by Step Solution
There are 3 Steps involved in it

Get step-by-step solutions from verified subject matter experts