

Conceptual Overview: Explore the sampling distribution of the difference between two means. The mean of a...
Fantastic news! We've Found the answer you've been seeking!
Question:
Transcribed Image Text:
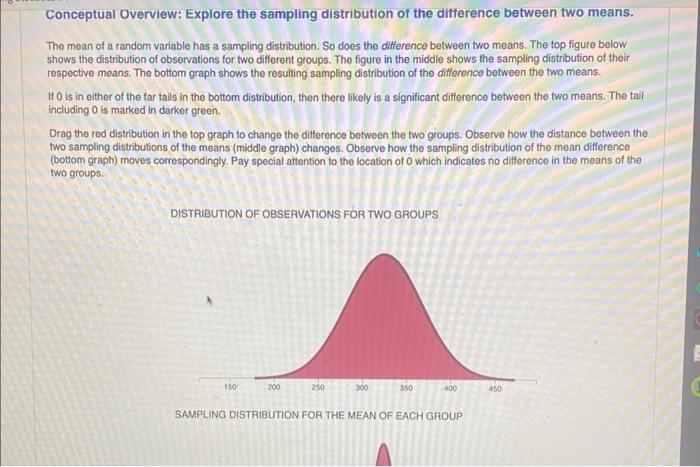
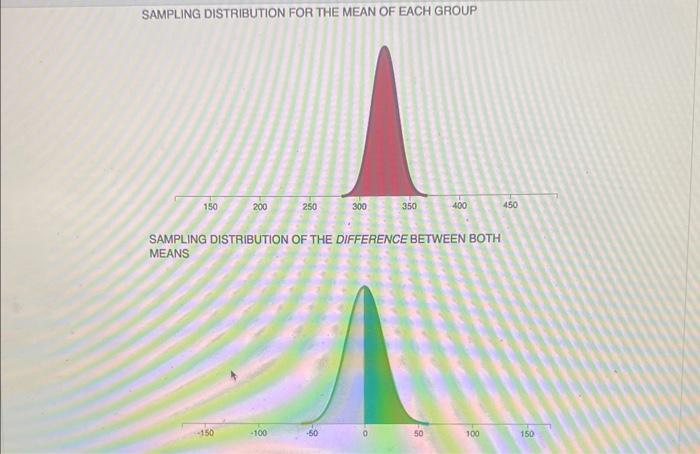
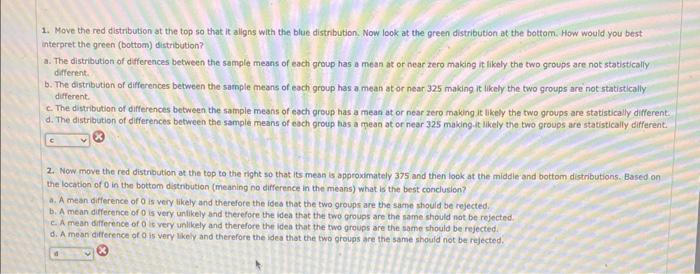
Conceptual Overview: Explore the sampling distribution of the difference between two means. The mean of a random variable has a sampling distribution. So does the difference between two means. The top figure below shows the distribution of observations for two different groups. The figure in the middle shows the sampling distribution of their respective means. The bottom graph shows the resulting sampling distribution of the difference between the two means. If 0 is in either of the far tails in the bottom distribution, then there likely is a significant difference between the two means. The tall including 0 is marked in darker green. Drag the red distribution in the top graph to change the difference between the two groups. Observe how the distance between the two sampling distributions of the means (middle graph) changes. Observe how the sampling distribution of the mean difference (bottom graph) moves correspondingly. Pay special attention to the location of 0 which indicates no difference in the means of the two groups. DISTRIBUTION OF OBSERVATIONS FOR TWO GROUPS 150 200 250 300 350 400 SAMPLING DISTRIBUTION FOR THE MEAN OF EACH GROUP 450 SAMPLING DISTRIBUTION FOR THE MEAN OF EACH GROUP 150 200 -150 250 -100 300 350 SAMPLING DISTRIBUTION OF THE DIFFERENCE BETWEEN BOTH MEANS 400 50 100 450 150 1. Move the red distribution at the top so that it aligns with the blue distribution. Now look at the green distribution at the bottom. How would you best interpret the green (bottom) distribution? a. The distribution of differences between the sample means of each group has a mean at or near zero making it likely the two groups are not statistically different. b. The distribution of differences between the sample means of each group has a mean at or near 325 making it likely the two groups are not statistically different. c. The distribution of differences between the sample means of each group has a mean at or near zero making it likely the two groups are statistically different. d. The distribution of differences between the sample means of each group has a mean at or near 325 making it likely the two groups are statistically different. 2. Now move the red distribution at the top to the right so that its mean is approximately 375 and then look at the middle and bottom distributions. Based on the location of 0 in the bottom distribution (meaning no difference in the means) what is the best conclusion? a. A mean difference of 0 is very likely and therefore the idea that the two groups are the same should be rejected. b. A mean difference of 0 is very unlikely and therefore the idea that the two groups are the same should not be rejected. c. A mean difference of 0 is very unlikely and therefore the idea that the two groups are the same should be rejected. d. A mean difference of 0 is very likely and therefore the idea that the two groups are the same should not be rejected. Conceptual Overview: Explore the sampling distribution of the difference between two means. The mean of a random variable has a sampling distribution. So does the difference between two means. The top figure below shows the distribution of observations for two different groups. The figure in the middle shows the sampling distribution of their respective means. The bottom graph shows the resulting sampling distribution of the difference between the two means. If 0 is in either of the far tails in the bottom distribution, then there likely is a significant difference between the two means. The tall including 0 is marked in darker green. Drag the red distribution in the top graph to change the difference between the two groups. Observe how the distance between the two sampling distributions of the means (middle graph) changes. Observe how the sampling distribution of the mean difference (bottom graph) moves correspondingly. Pay special attention to the location of 0 which indicates no difference in the means of the two groups. DISTRIBUTION OF OBSERVATIONS FOR TWO GROUPS 150 200 250 300 350 400 SAMPLING DISTRIBUTION FOR THE MEAN OF EACH GROUP 450 SAMPLING DISTRIBUTION FOR THE MEAN OF EACH GROUP 150 200 -150 250 -100 300 350 SAMPLING DISTRIBUTION OF THE DIFFERENCE BETWEEN BOTH MEANS 400 50 100 450 150 1. Move the red distribution at the top so that it aligns with the blue distribution. Now look at the green distribution at the bottom. How would you best interpret the green (bottom) distribution? a. The distribution of differences between the sample means of each group has a mean at or near zero making it likely the two groups are not statistically different. b. The distribution of differences between the sample means of each group has a mean at or near 325 making it likely the two groups are not statistically different. c. The distribution of differences between the sample means of each group has a mean at or near zero making it likely the two groups are statistically different. d. The distribution of differences between the sample means of each group has a mean at or near 325 making it likely the two groups are statistically different. 2. Now move the red distribution at the top to the right so that its mean is approximately 375 and then look at the middle and bottom distributions. Based on the location of 0 in the bottom distribution (meaning no difference in the means) what is the best conclusion? a. A mean difference of 0 is very likely and therefore the idea that the two groups are the same should be rejected. b. A mean difference of 0 is very unlikely and therefore the idea that the two groups are the same should not be rejected. c. A mean difference of 0 is very unlikely and therefore the idea that the two groups are the same should be rejected. d. A mean difference of 0 is very likely and therefore the idea that the two groups are the same should not be rejected.
Expert Answer:

Related Book For 

Posted Date:
Students also viewed these mathematics questions
-
I dont understand how I can go from a profit to a loss when I sell more units. This comment aptly sums Emily Johnsons frustration with her accounting statements. Emily owns and operates a small firm...
-
I have lost almost all of my receipts and I wanted to see if there are any rules that allow you to make deductions to your income taxes form without having receipts. For example gas etc. What is the...
-
I need someone to log into my Sam account and help me with my next two assignments using the Microsoft Access. You'll need a windows computer to complete this assignment.
-
Perform the indicated operations. (3x + 4x 7) (2x - 8x + 3x) -
-
Schwartz Transport owns a lorry with a one-year old engine. It has to decide whether or not to replace the engine at a cost of ¬2,000. If it does not replace the engine, there is an increased...
-
Fortin Co.?s ledger is as follows: Instructions a. Journalize the October transactions. b. Determine the October 31, 2021, balance for each account. Prepare a trial balance at October 31, 2021. Cash...
-
Regional Highway Transport is a large trucking company. Regional Highway Transport uses the units-of-production (UOP) method to depreciate its trucks. In 2009, Regional Highway Transport acquired a...
-
Repeat Example 5.3 for N = 1, 3, 10, and 30 stages. Plot the percent absorption of each of the five hydrocarbons and the total feed gas, as well as the percent stripping of the oil versus the number...
-
Provide an outline of the steps for the change management and configuration management processes of the new server as well as the website that needs to be updated and hosted. This information should...
-
Hastings Company bases its variable overhead performance report on the actual direct labour- hours of the period. Data concerning the most recent year, which ended on December 31, are as follows:...
-
On January 1, 2020, Jeanne Company granted the president compensatory share options to buy 5,000 shares of P100 par value. The options call for a price of P120 per share and are exercisable for four...
-
Does your organization use financial benchmarking? Would you use it if you had a chance to do so? Why?
-
List the steps involved in pretrial proceedings in the order that they occur after arrest.
-
For the conditions of Example 20.1. how many ideal stages would be needed for 97 percent absorption of the acetone of the incoming oil contained 0.005 mol fraction acetone? Example 20.1 By means of a...
-
Briefly explain the different types of appeals.
-
Have you, in the course of your work, had to estimate items for reports? If so, what type of items? How did you go about estimating?
-
Which of these is known to be a source of workplace stress? Employees' position with the company Interpersonal relationships with colleagues Employees career development All of these answers
-
Do animals have rights? If so, what are they? What duties do human beings have toward animals? Does KFC protect animal welfare at an acceptable level?
-
Explain why stepwise regression is used. What is its value in the model-building process?
-
Refer to Exercise 8.153. a. In the context of the problem, define a Type II error. b. Calculate b for the test described in part a of Exercise 8.153, assuming that the true mean is = 3.1 ppm. c....
-
Refer to the Environmental Geology (Vol. 58, 2009) simulation study of how far a block from a collapsing rockwall will bounce down a soil slope, Recall that the variable of interest was rebound...
-
Ammonia synthesis reaction is represented by \[ \mathrm{N}_{2}(\mathrm{~g})+3 \mathrm{H}_{2}(\mathrm{~g}) ightarrow 2 \mathrm{NH}_{3}(\mathrm{~g}) \] Initially, \(1 \mathrm{~mol}\) of nitrogen and...
-
A mixture of \(1 \mathrm{~mol}\) of sulphur dioxide gas, \(0.5 \mathrm{~mol}\) of oxygen gas and \(2 \mathrm{~mol}\) of argon gas are fed into a reactor at \(30 \mathrm{bar}\) and \(900 \mathrm{~K}\)...
-
The dissociation of phosphorus pentachloride takes place at \(250^{\circ} \mathrm{C}\) as \[ \mathrm{PCl}_{5} ightleftharpoons \mathrm{PCl}_{3}+\mathrm{Cl}_{2} \quad K_{P}=1.8 \] Calculate the...

Study smarter with the SolutionInn App