

Question: I cannot get this code to work. In this problem, we will use grouping operations to determine the number of houses sold for each of
I cannot get this code to work.
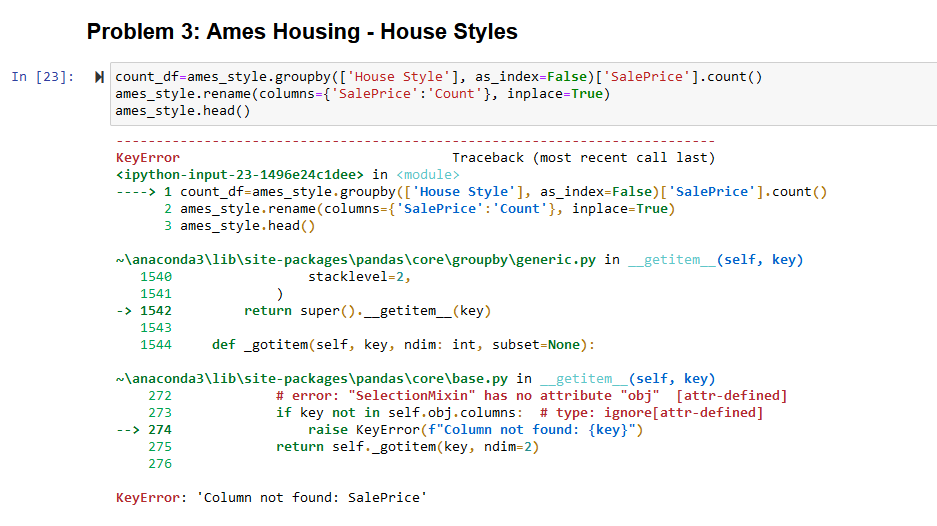
In this problem, we will use grouping operations to determine the number of houses sold for each of the eight house styles provided in the Ames Housing dataset. Create a DataFrame named ames_style as follows: 1. Select the House Style and SalePrice columns from ames. 2. Group by House Style, and then calculate the count of SalePrice for each group. 3. Sort the rows of the DataFrame according to the count column, in increasing order. By default, the count column in the resulting DataFrame will be named SalePrice. Change the name of this column to Count by using the following code: \[ \text { ames_style.rename(columns }=\{\text { 'SalePrice' : Count' }\} \text {, inplace=True) } \] Display ames_style. We will graphically represent the information above using a bar chart. Create a standard (vertical) bar chart displaying the number of houses sold for each of the house styles. The labels for the bars should correspond to the different house styles, and can be set using the index of the ames_style DataFrame. Set the figure size to be [6,4], and choose a single named color to use for the bars. The x-axis should be labeled "House Style" and the y-axis should be labeled "Count". The title of the chart should be "Houses Sold by House Style". The height of the bars in this chart should increase as you move from left to right. \begin{tabular}{l|l} In [1]: M & importnumpyasnpimportpandasaspdimportmatplotlib.pyplotasplt \end{tabular} In [2]: N Problem 3: Ames Housing - House Styles
Step by Step Solution
There are 3 Steps involved in it

Get step-by-step solutions from verified subject matter experts