Question: I could use some assistance on this problem set because i am unaware of how to complete it Year 0 1 2 3 4 5
I could use some assistance on this problem set because i am unaware of how to complete it
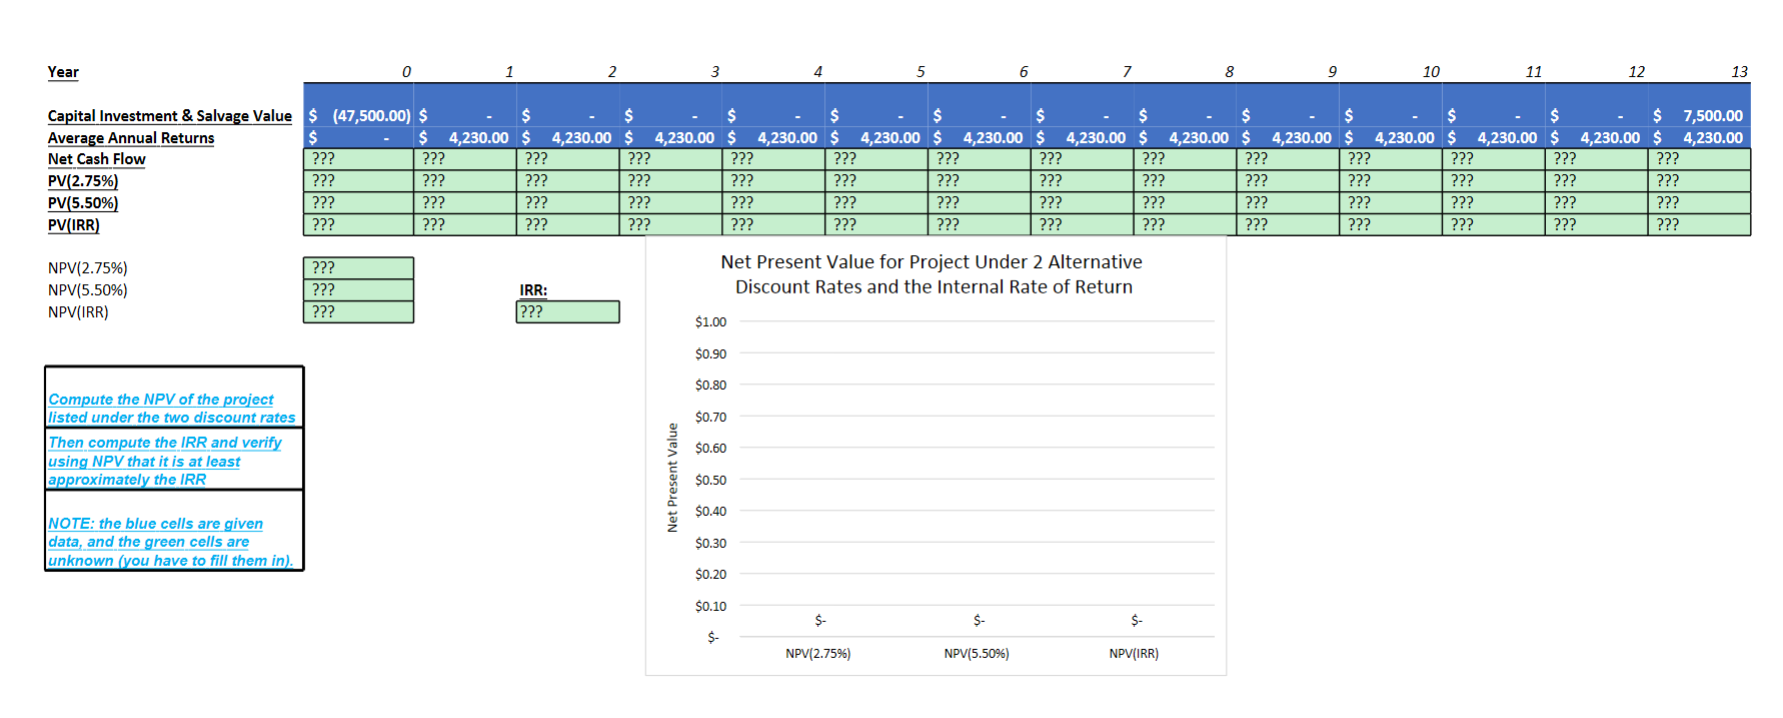
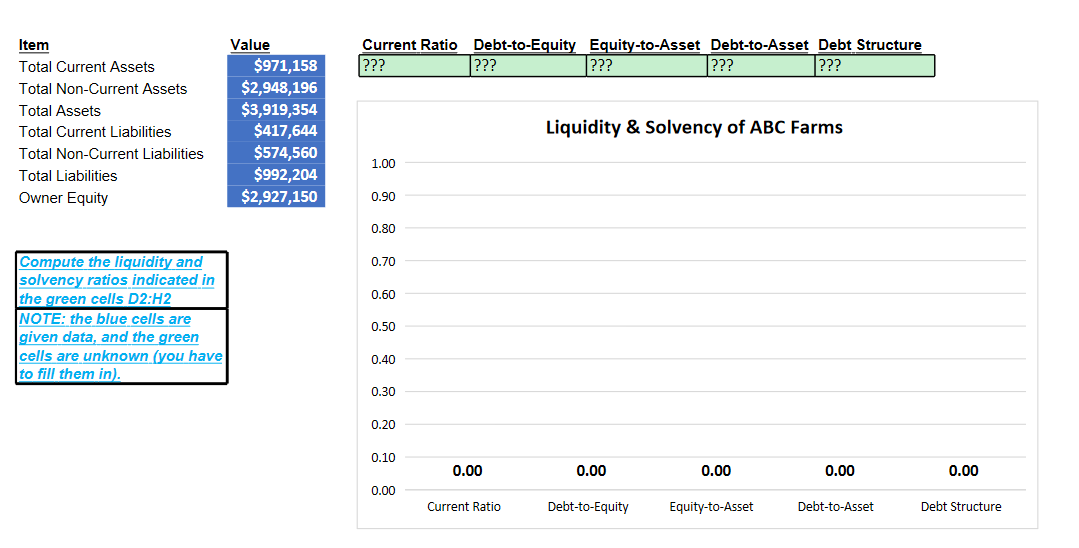
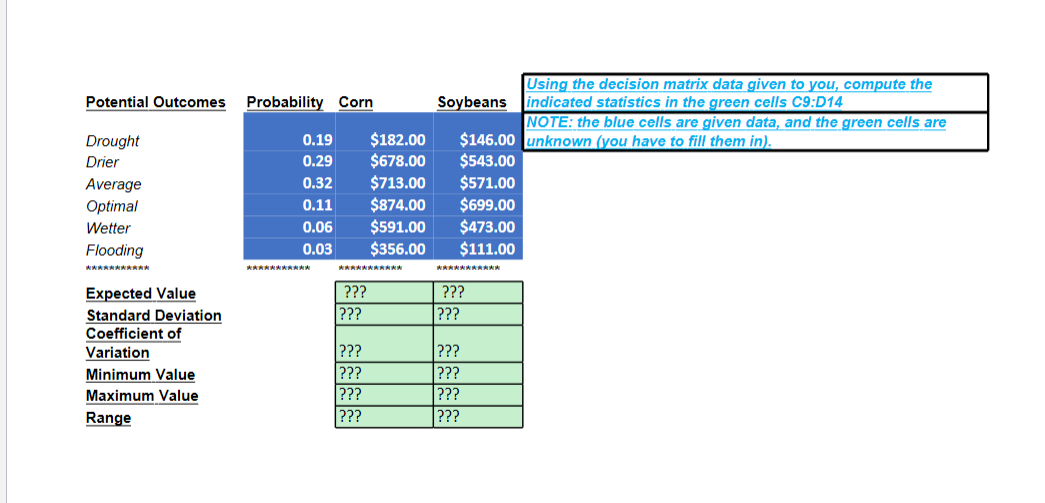
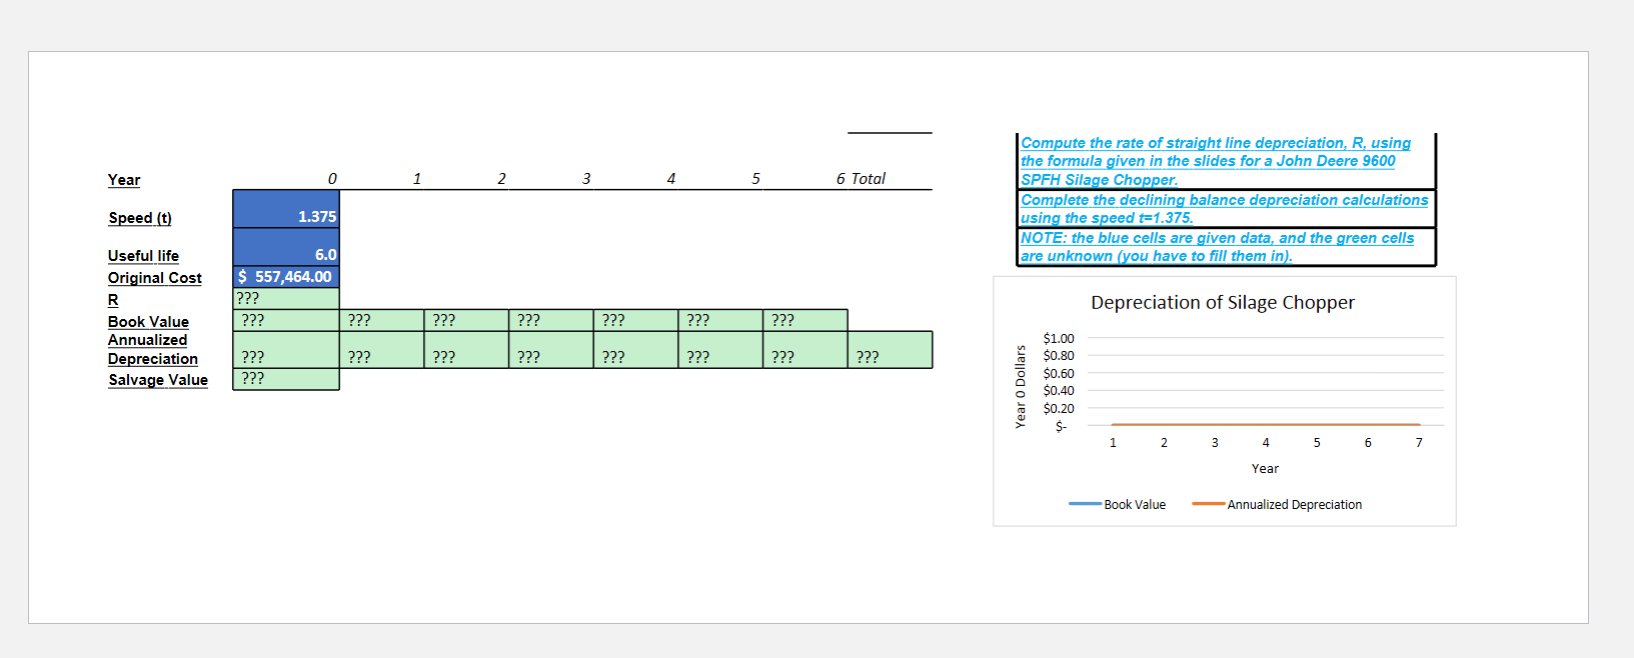
Year 0 1 2 3 4 5 5 7 8 9 10 11 12 13 Capital Investment & Salvage Value $ (47,500.00) $ $ 7,500.00 Average Annual Returns S 4,230.00 S 4,230.00 4,230.00 S 4,230.00 S 4,230.00 S 4,230.00 S 4,230.00 4,230.00 4,230.00 4,230.00 4,230.00 S 4,230.00 4,230.00 Net Cash Flow ??? ??? ??? ??? ??? ??? ??? ??? ??? ??? ??? ??? ?? ??? PV(2.75%) ??? ??? ??? ??? ??? ??? ??? ??? ??? ??? ??? ??? ??? PV(5.50%) ??? ??? ??? ??? ??? ??? ??? ??? ??? ??? ??? ??? ??? ??? PV(IRR) ??? ??? ??? ??? ??? ??? ??? ??? ??? ??? ??? ??? ??? ??? NPV(2.75%) ??? Net Present Value for Project Under 2 Alternative NPV(5.50%) ??? IRR Discount Rates and the Internal Rate of Return NPV(IRR) ??? ??? $1.00 $0.90 $0.80 Compute the NPV of the project listed under the two discount rates $0.70 Then compute the IRR and verify $0.60 using NPV that it is at least approximately the IRR Net Present Value $0.50 $0.40 NOTE: the blue cells are given data, and the green cells are $0.30 unknown (you have to fill them in). $0.20 $0.10 S- S- S- S- NPV(2.75%) NPV(5.50%) NPV(IRR)Item Value Current Ratio Debt-to-Equity Equity-to-Asset Debt-to-Asset Debt Structure Total Current Assets $971,158 ??? ??? ??? ??? ??? Total Non-Current Assets $2,948,196 Total Assets $3,919,354 Total Current Liabilities $417,644 Liquidity & Solvency of ABC Farms Total Non-Current Liabilities $574,560 1.00 Total Liabilities $992,204 Owner Equity $2,927,150 0.90 0.80 Compute the liquidity and 0.70 solvency ratios indicated in the green cells D2:H2 0.60 NOTE: the blue cells are 0.50 given data, and the green cells are unknown (you have 0.40 to fill them in). 0.30 0.20 0.10 0.00 0.00 0.00 0.00 0.00 0.00 Current Ratio Debt-to-Equity Equity-to-Asset Debt-to-Asset Debt StructureUsing the decision matrix data given to you, compute the Potential Outcomes Probability Corn Soybeans indicated statistics in the green cells C9:D14 NOTE: the blue cells are given data, and the green cells are Drought 0.19 $182.00 $146.00 unknown (you have to fill them in). Drier 0.29 $678.00 $543.00 Average 0.32 $713.00 $571.00 Optimal 0.11 $874.00 $699.00 Wetter 0.06 $591.00 $473.00 Flooding 0.03 $356.00 $111.00 Expected Value ??? ??? Standard Deviation ??? ??? Coefficient of Variation ??? ??? Minimum Value ??? ??? Maximum Value ??? ??? Range ??? ???Compute the rate of straight line depreciation, R, using the formula given in the slides for a John Deere 9600 Year 0 1 2 3 4 5 6 Total SPFH Silage Chopper. Complete the declining balance depreciation calculations Speed (t) 1.375 using the speed t=1.375. NOTE: the blue cells are given data, and the green cells Useful life 6.0 are unknown (you have to fill them in). Original Cost $ 557,464.00 R ??? Depreciation of Silage Chopper Book Value ??? ??? ??? ??? ??? ??? ??? Annualized $1.00 Depreciation ??? ??? ??? ??? ??? ??? ??? ??? $0.80 Salvage Value ??? SO.60 $0.40 Year 0 $0.20 S- 1 2 3 4 5 6 Year - Book Value Annualized Depreciation