

Question: I couldn't do it Q2. (22 pts) According to Total UK product sales data time series analysis with the first difference results in ARIMA model
I couldn't do it
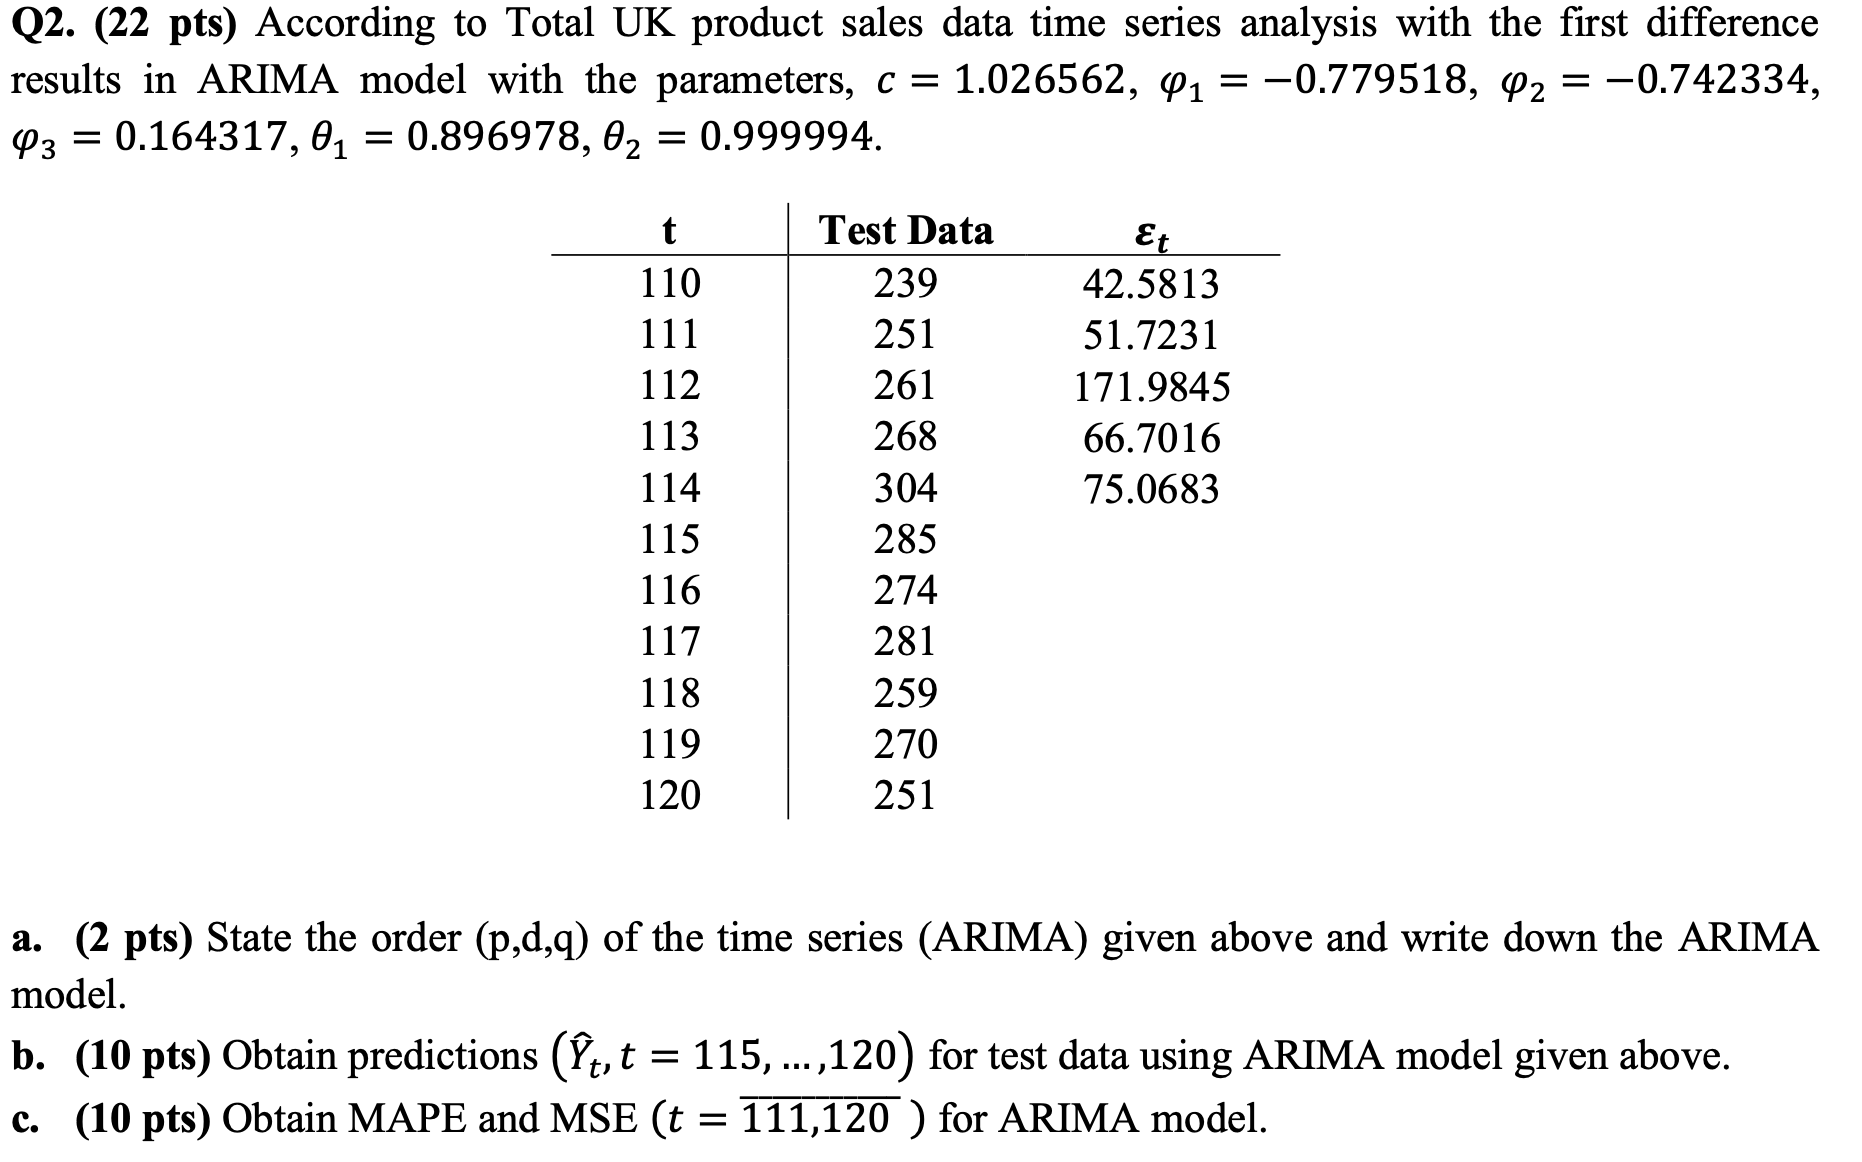
Q2. (22 pts) According to Total UK product sales data time series analysis with the first difference results in ARIMA model with the parameters, c = 1.026562, Q1 = -0.779518, 42 = -0.742334, 43 = 0.164317, 01 = 0.896978, 02 = 0.999994. Test Data Et 110 239 42.5813 111 251 51.7231 112 261 171.9845 113 268 66.7016 114 304 75.0683 115 285 116 274 117 281 118 259 119 270 120 251 a. (2 pts) State the order (p,d,q) of the time series (ARIMA) given above and write down the ARIMA model. b. (10 pts) Obtain predictions (Yt, t = 115, ...,120) for test data using ARIMA model given above. c. (10 pts) Obtain MAPE and MSE (t = 111,120 ) for ARIMA model
Step by Step Solution
There are 3 Steps involved in it

Get step-by-step solutions from verified subject matter experts