

Question: I couldn't know to solve it The Pareto chart indicates that most of the complaints, , were caused by (round your response to one decimal
I couldn't know to solve it

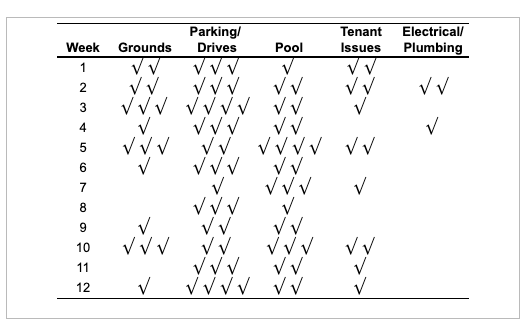
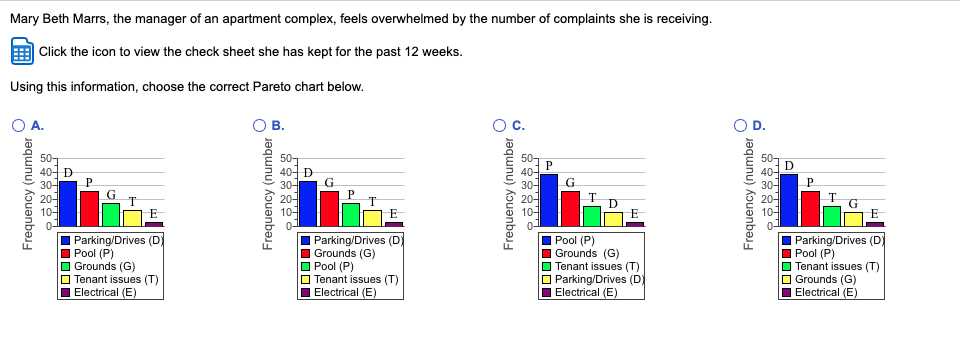
The Pareto chart indicates that most of the complaints, , were caused by (round your response to one decimal place).\fMary Beth Marrs, the manager of an apartment complex, feels overwhelmed by the number of complaints she is receiving. Click the icon to view the check sheet she has kept for the past 12 weeks. Using this information, choose the correct Pareto chart below. O A. OB. O C. OD. 50J 50 507 507 P D 40- D 40- D 40- 40- G P G 30- P 30- Frequency (number Frequency (number Frequency (number P I I Frequency (number G 20- 20- 10- 10- Parking/Drives (D) Parking/Drives (D) Pool (P) Parking/Drives (D Grounds (G) 10 Pool (P) Grounds (G) Pool (P) Tenant issues (T) Grounds (G) Pool (P) Tenant issues (T) Tenant issues (T) Parking/Drives (D Grounds (G) Tenant issues (T) Electrical (E) Electrical (E) Electrical (E) Electrical (E)
Step by Step Solution
There are 3 Steps involved in it

Get step-by-step solutions from verified subject matter experts