

Question: I couldn't solve the question The two graphs have different modes. The mode(s) for women is(are) ... and the mode(s) for men is(are) .... Would
I couldn't solve the question "The two graphs have different modes. The mode(s) for women is(are) ... and the mode(s) for men is(are) ...". Would you please help me and explain? Thank you very much!
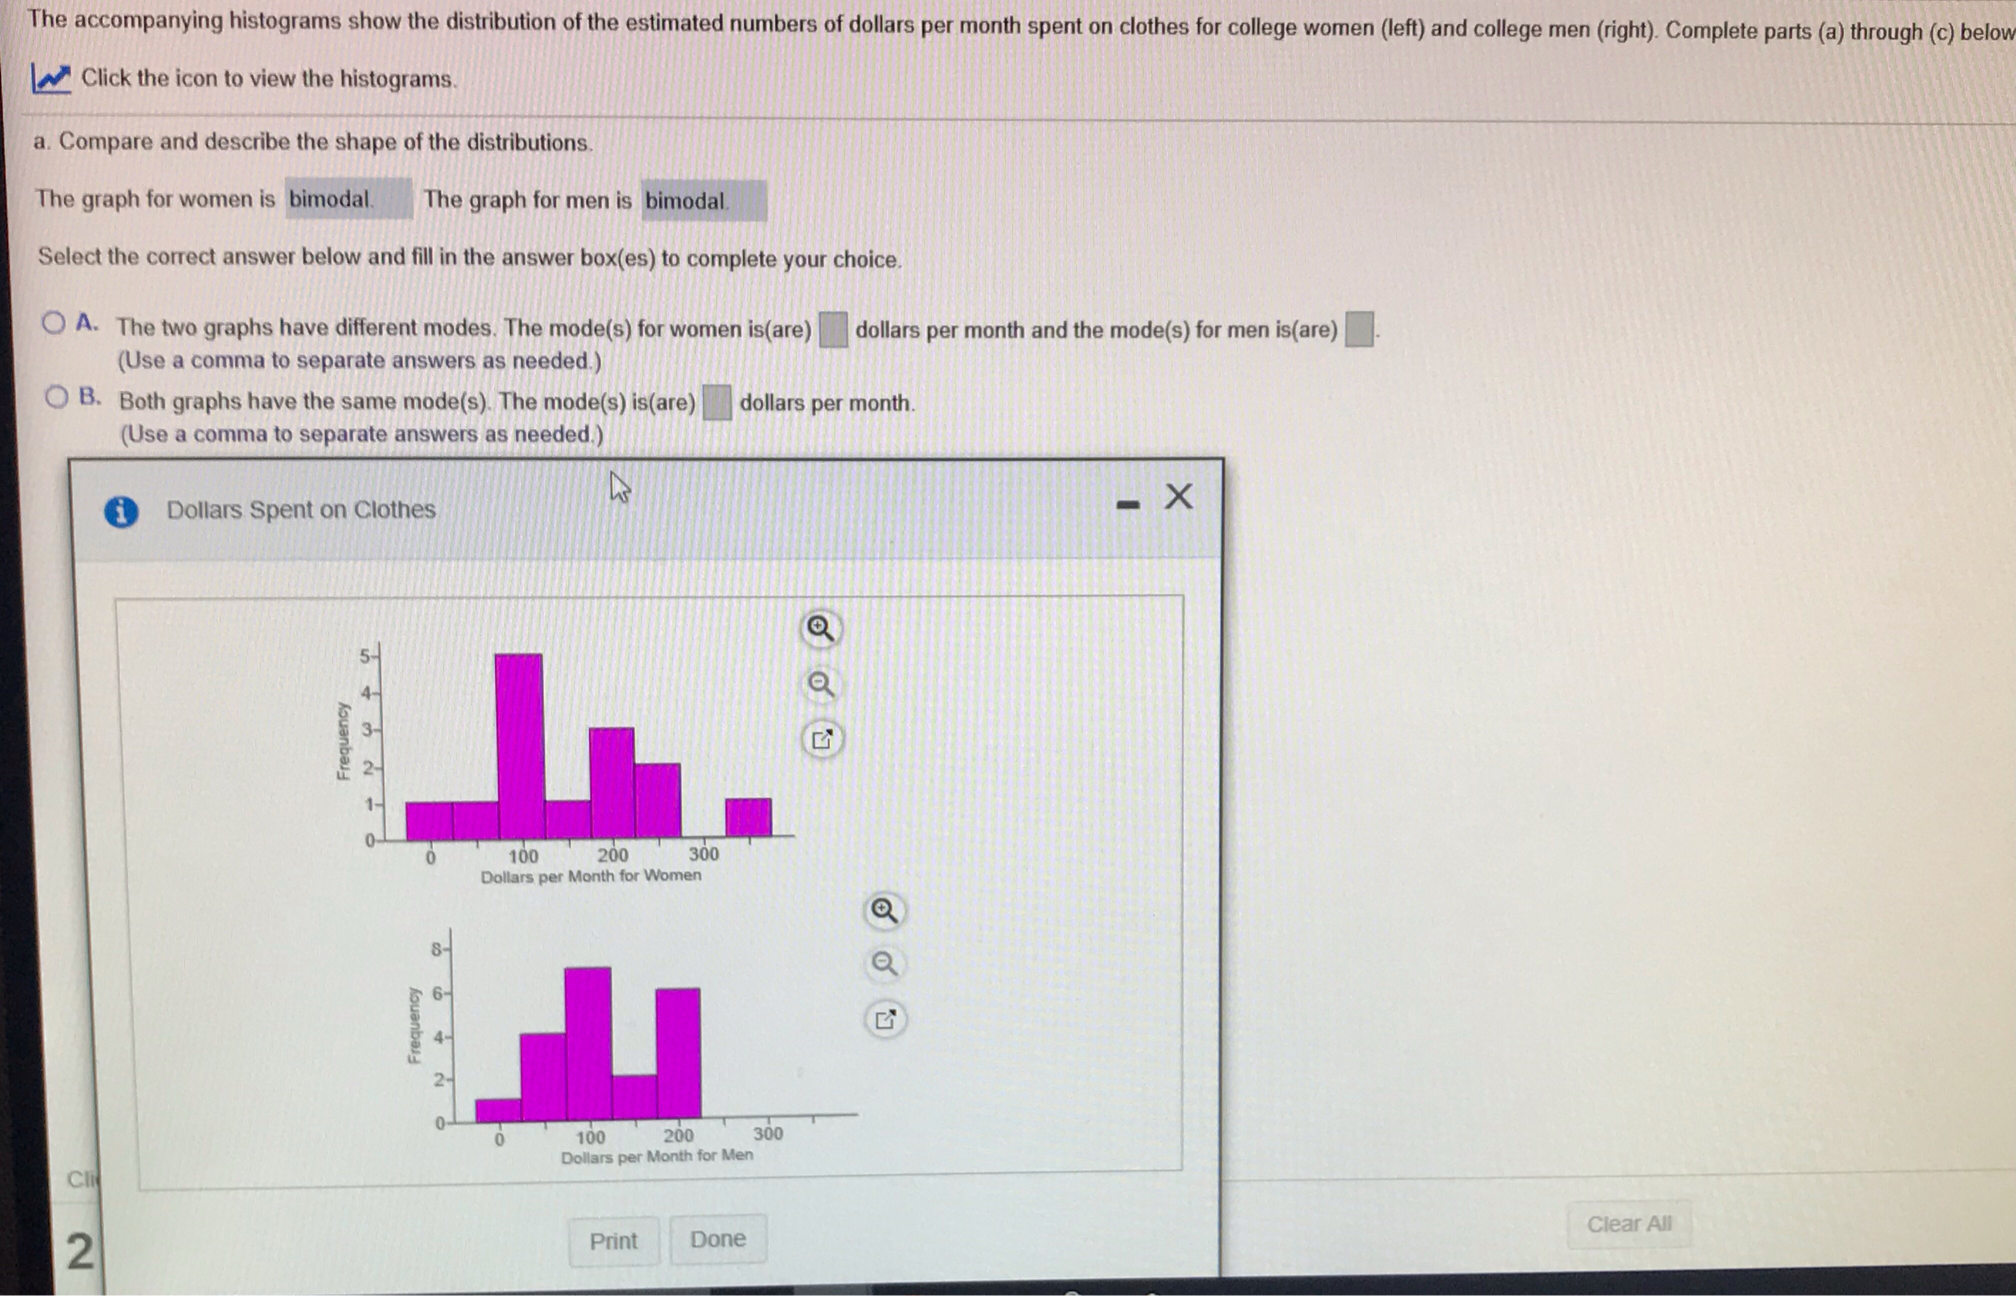
The accompanying histograms show the distribution of the estimated numbers of dollars per month spent on clothes for college women (left) and college men (right). Complete parts (a) through (c) below Click the icon to view the histograms. a. Compare and describe the shape of the distributions. The graph for women is bimodal. The graph for men is bimodal. Select the correct answer below and fill in the answer box(es) to complete your choice. A. The two graphs have different modes. The mode(s) for women is(are) dollars per month and the mode(s) for men is(are) (Use a comma to separate answers as needed.) O B. Both graphs have the same mode(s). The mode(s) is(are) |dollars per month. (Use a comma to separate answers as needed.) Dollars Spent on Clothes - X Frequency 0 100 200 300 Dollars per Month for Women Frequency 100 200 300 Cli Dollars per Month for Men 2 Print Done Clear All
Step by Step Solution
There are 3 Steps involved in it

Get step-by-step solutions from verified subject matter experts