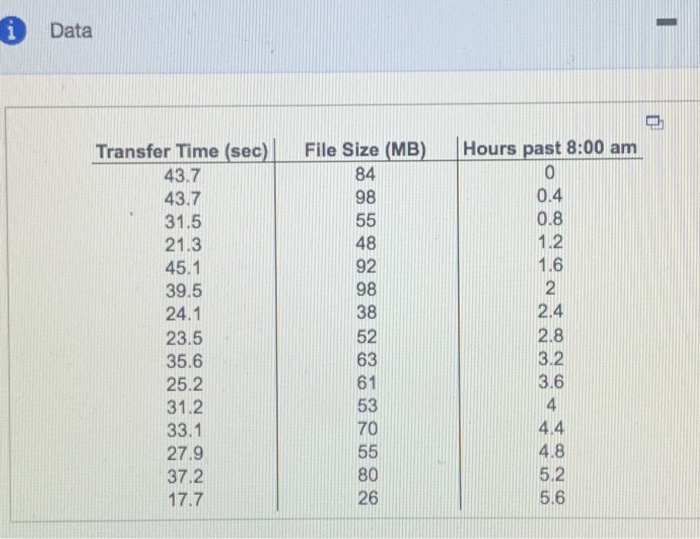
Question: i Data 3 Transfer Time (sec) 43.7 43.7 31.5 21.3 45.1 39.5 24.1 23.5 35.6 25.2 31.2 33.1 27.9 37.2 17.7 File Size (MB) 84

i Data 3 Transfer Time (sec) 43.7 43.7 31.5 21.3
i Data 3 Transfer Time (sec) 43.7 43.7 31.5 21.3 45.1 39.5 24.1 23.5 35.6 25.2 31.2 33.1 27.9 37.2 17.7 File Size (MB) 84 98 55 48 92 98 38 52 63 61 53 70 55 80 26 Hours past 8:00 am 0 0.4 0.8 1.2 1.6 2 2.4 2.8 3.2 3.6 4 4.4 4.8 5.2 5.6 A company measured how rapidly data moved through its internal computer network under a typical load. Fifteen fles ranging in size from 20 to 100 megabytes (MB) were transmitted over the network at various times of the day and the time to send in seconds) was recorded. Use the data found below to formulate the simple regression model (SRM) with y given by Transfer Time and given by File Size. Complete parts a through below Click the icon to view the data (a) Plot the residuals versus the x-variable and in time order as indicated by the column labeled Hours past 8:00 am. Does other plot suggest a problem with the SRM? Which plot below shows the residuals versus the x-variable? . 6 6 . @ 0. 0 100 100 20 100 Which plot below shows the residuals in time order? Which plot below shows the residuals in time order? OA . OC 0 .. 0 1 0 0 8.00 am Hour 8:00 am Hour's past 8.00 am Does other plot suggest a problem with the SRM? Select all that apply. DA The timeplot of the residuals indicates that the variances are not equal B. The plot of the residuals versus x indicates that the variances are not equal C. The timeplot of the residuals indicates that the data are not independent D. Neither plot shows any violation of the conditions for the SRM DE The plot of the residuals versus x indicates that the data are not independent (b) Compute the Dutin Watson D statinio Does it indicate a problem? For a series of this longth, any value of that is more than 0.84 away from 2 is statistically significant with p-value smaller than 0.01 Calculate D-(Round to two decimal places as needed) Since the value of Dis than 0.64 away from 2, there v evidence of autocorrelation Click to select your an more less D=(Round to two decimal places as needed.) Since the value of Dis than 0.64 away from 2, there evidence of autocorrelation. (c) Explain or interpret the result of the Durbin-Watson test. O A. The sign of the residuals alternates, but this pattern was not noticeable in the timeplot. B. Since the residuals are uncorrelated, there is no problem with the SRM. OC. Since the variation is increasing, the residuals are correlated. OD. The Durbin-Watson test confirms the conclusion from part a. Click to select your answer(s). i Data 3 Transfer Time (sec) 43.7 43.7 31.5 21.3 45.1 39.5 24.1 23.5 35.6 25.2 31.2 33.1 27.9 37.2 17.7 File Size (MB) 84 98 55 48 92 98 38 52 63 61 53 70 55 80 26 Hours past 8:00 am 0 0.4 0.8 1.2 1.6 2 2.4 2.8 3.2 3.6 4 4.4 4.8 5.2 5.6 A company measured how rapidly data moved through its internal computer network under a typical load. Fifteen fles ranging in size from 20 to 100 megabytes (MB) were transmitted over the network at various times of the day and the time to send in seconds) was recorded. Use the data found below to formulate the simple regression model (SRM) with y given by Transfer Time and given by File Size. Complete parts a through below Click the icon to view the data (a) Plot the residuals versus the x-variable and in time order as indicated by the column labeled Hours past 8:00 am. Does other plot suggest a problem with the SRM? Which plot below shows the residuals versus the x-variable? . 6 6 . @ 0. 0 100 100 20 100 Which plot below shows the residuals in time order? Which plot below shows the residuals in time order? OA . OC 0 .. 0 1 0 0 8.00 am Hour 8:00 am Hour's past 8.00 am Does other plot suggest a problem with the SRM? Select all that apply. DA The timeplot of the residuals indicates that the variances are not equal B. The plot of the residuals versus x indicates that the variances are not equal C. The timeplot of the residuals indicates that the data are not independent D. Neither plot shows any violation of the conditions for the SRM DE The plot of the residuals versus x indicates that the data are not independent (b) Compute the Dutin Watson D statinio Does it indicate a problem? For a series of this longth, any value of that is more than 0.84 away from 2 is statistically significant with p-value smaller than 0.01 Calculate D-(Round to two decimal places as needed) Since the value of Dis than 0.64 away from 2, there v evidence of autocorrelation Click to select your an more less D=(Round to two decimal places as needed.) Since the value of Dis than 0.64 away from 2, there evidence of autocorrelation. (c) Explain or interpret the result of the Durbin-Watson test. O A. The sign of the residuals alternates, but this pattern was not noticeable in the timeplot. B. Since the residuals are uncorrelated, there is no problem with the SRM. OC. Since the variation is increasing, the residuals are correlated. OD. The Durbin-Watson test confirms the conclusion from part a. Click to select your answer(s)

Step by Step Solution

There are 3 Steps involved in it

1 Expert Approved Answer
Step: 1 Unlock blur-text-image
Question Has Been Solved by an Expert!

Get step-by-step solutions from verified subject matter experts

Step: 2 Unlock
Step: 3 Unlock

Students Have Also Explored These Related General Management Questions!