

Question: i Data Table Eta Designs, Inc. Comparative Balance Sheet December 31, 2018 and 2017 2018 2017 Assets Total Current Assets Property, Plant, and Equipment, Net
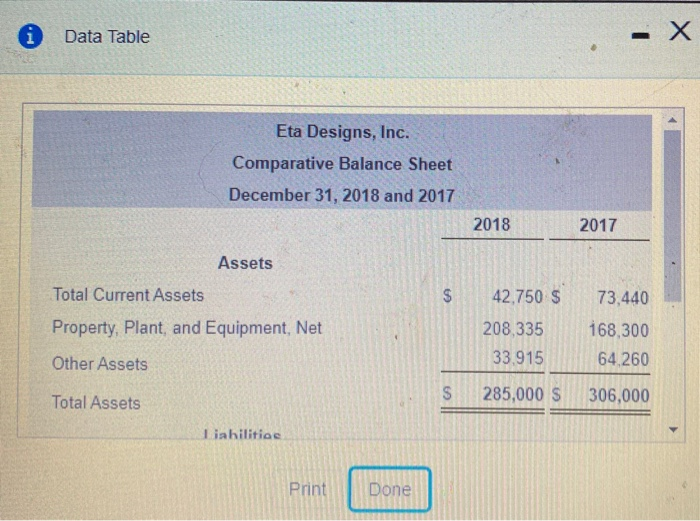
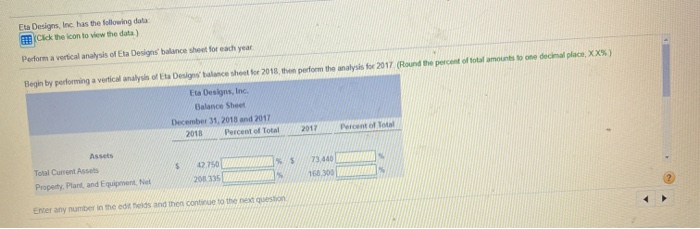
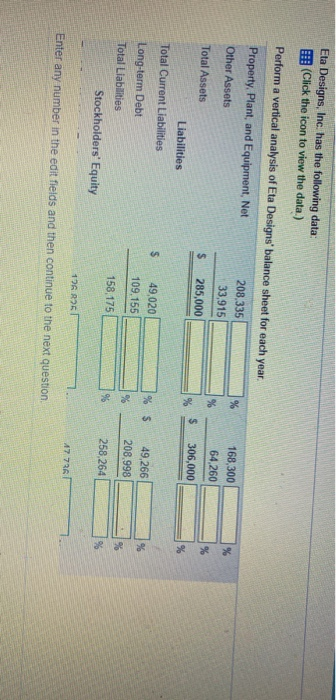
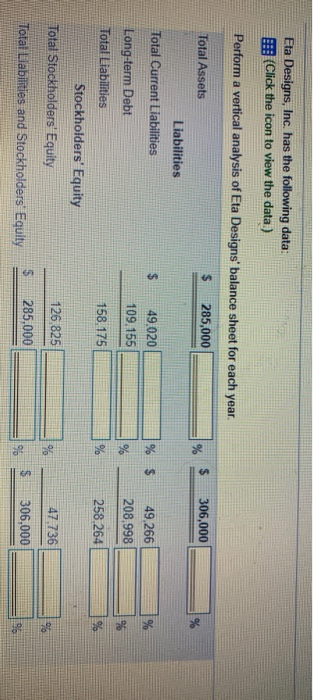
i Data Table Eta Designs, Inc. Comparative Balance Sheet December 31, 2018 and 2017 2018 2017 Assets Total Current Assets Property, Plant, and Equipment, Net Other Assets 42.750 $ 208,335 33.915 73,440 168,300 64,260 306,000 Total Assets 285,000 S nint Done Done Eta Designs, Inc. has the following data Click the icon to view the data) Perform a vertical analysis of Eta Designs balance sheet for each year Begin by performing a vertical analysis ofta Designs talance sheet for 2018 the perform the analysis for 2017 (Round the percent of total amounts to one decimal place, XXS) Eta Designs, Inc. Balance Sheet December 31, 2018 and 2017 2018 Percent of Total 2017 Percent of You Assets Total Current Assets $ 750 5 73,60 Property. Plant, and Equipment. Net 2015 Enter any number in the edities and then continue to the next question Eta Designs, Inc. has the following data: (Click the icon to view the data.) 168,300 64,260 306,000 Perform a vertical analysis of Eta Designs' balance sheet for each year. Property. Plant, and Equipment, Net 208,335 Other Assets 33,915 Total Assets $ 285,000 Liabilities Total Current Liabilities 49,020 Long-term Debt 109.155 Total Liabilities 158,175 Stockholders' Equity 126 125 % $ 49,266 208.998 258,264 47736 Enter any number in the edit fields and then continue to the next question Eta Designs, Inc. has the following data: (Click the icon to view the data.) 306,000 Perform a vertical analysis of Eta Designs' balance sheet for each year. Total Assets $ 285,000 Liabilities Total Current Liabilities 49,020 Long-term Debt 109.155 Total Liabilities 158, 175 Stockholders' Equity Total Stockholders' Equity 126,825 Total Liabilities and Stockholders' Equity 285,000 49,266 208,998 258,264 47,736 $ 306,000
Step by Step Solution
There are 3 Steps involved in it

Get step-by-step solutions from verified subject matter experts