

Question: I. Dependent (Y) Variable Analysis 1. What is the name of your dependent variable? Spending on education. (Much more to much less) 2. What is
I. Dependent (Y) Variable Analysis
1. What is the name of yourdependent variable?
Spending on education. (Much more to much less)
2. What is its level of measurement? Explain why.
3. What is the survey question that was asked corresponding to this variable?
4. Are these categoriesmutually exclusive? Why or why not?
5. Are these categoriesexhaustive? Why or why not?
6. Paste the frequency table for your dependent variable here.
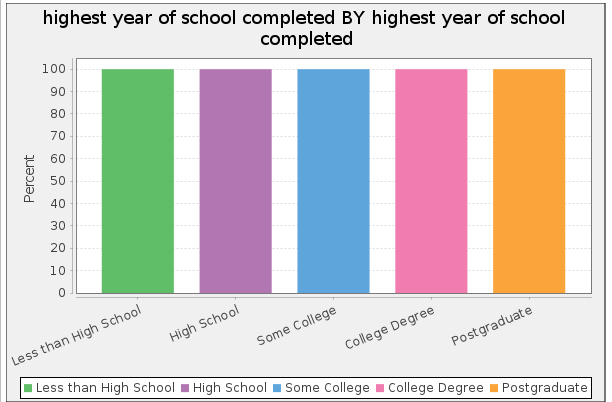
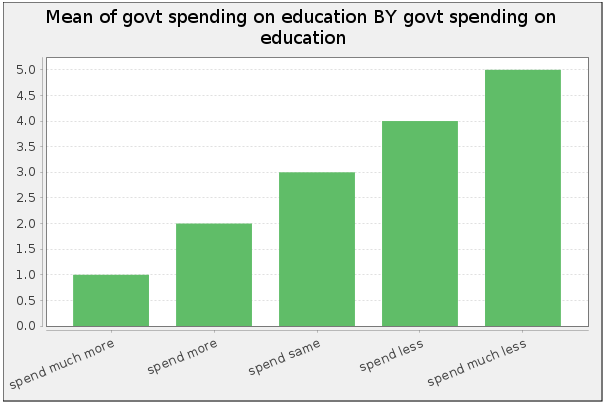
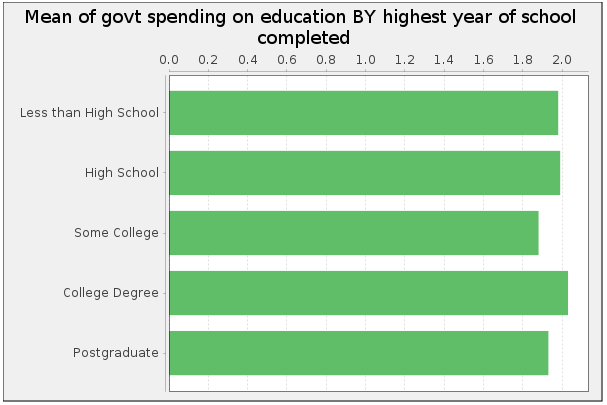
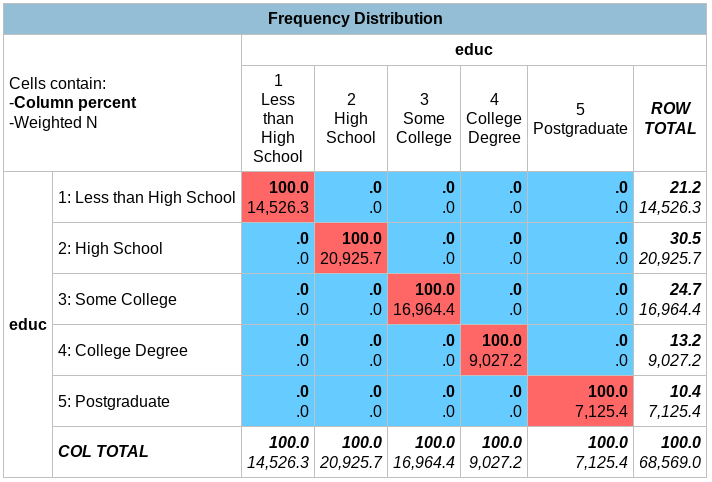
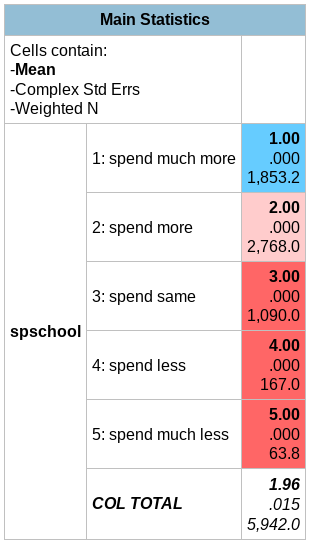
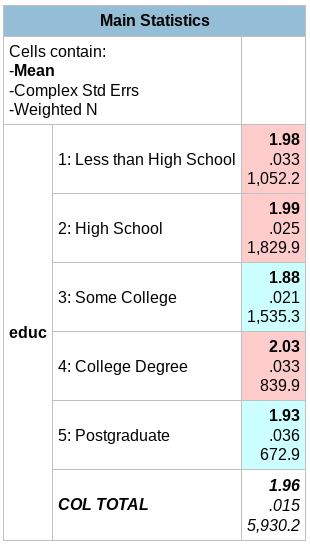
highest year of school completed BY highest year of school completed 100 90 80 70 60 Percent 50 40 30 20 10 High School Less than High School Some College College Degree Postgraduate Less than High School _ High School _ Some College . College Degree . PostgraduateMean of govt spending on education BY govt spending on education 5,0 4.5 4.0 3.5 3.0 2.5 2.0 1.5 1.0 0.5 0.0 spend much more spend more spend same spend less spend much lessMean of govt spending on education BY highest year of school completed 0.0 0.2 0.4 0.6 0.8 1.0 1.2 1.4 1.6 1.8 2.0 Less than High School High School Some College College Degree PostgraduateFrequency Distribution educ Cells contain: 1 Column percent Less 2 3 4 Weighted N High Some 5 ROW than College High School College Degree Postgraduate TOTAL School 21.2 1: Less than High School 100.0 14,526.3 0 14,526.3 100.0 30.5 2: High School 0 .0 bb bb bb .0 20,925.7 .0 20,925.7 100.0 24.7 3: Some College 16,964.4 0 16,964.4 educ 100.0 4: College Degree .0 13.2 bb bb bb 9,027.2 9,027.2 100.0 10.4 5: Postgraduate 7,125.4 7,125.4 COL TOTAL 100.0 100.0 100.0 100.0 100.0 100.0 14,526.3 20,925.7 16,964.4 9,027.2 7,125.4 68,569.0Main Statistics Cells contain: Mean -Complex Std Errs Weighted N 1.00 1: spend much more 000 1,853.2 2.00 2: spend more 000 2,768.0 3.00 3: spend same 000 1,090.0 spschool 4.00 4: spend less 000 167.0 5.00 5: spend much less 000 63.8 1.96 COL TOTAL .015 5,942.0Main Statistics Cells contain: Mean Complex Std Errs Weighted N 1.98 1: Less than High School .033 1,052.2 1.99 2: High School 025 1,829.9 1.88 3: Some College .021 1,535.3 educ 2.03 4: College Degree 033 839.9 1.93 5: Postgraduate .036 672.9 1.96 COL TOTAL .015 5,930.2
Step by Step Solution
There are 3 Steps involved in it

Get step-by-step solutions from verified subject matter experts