

Question: I did a & b. I got stuck on c. I can not seem to get the right graph I tried excel and MATLAB. Please
I did a & b. I got stuck on c. I can not seem to get the right graph I tried excel and MATLAB. Please do not just show me the actual graph. I need to know how to get it.
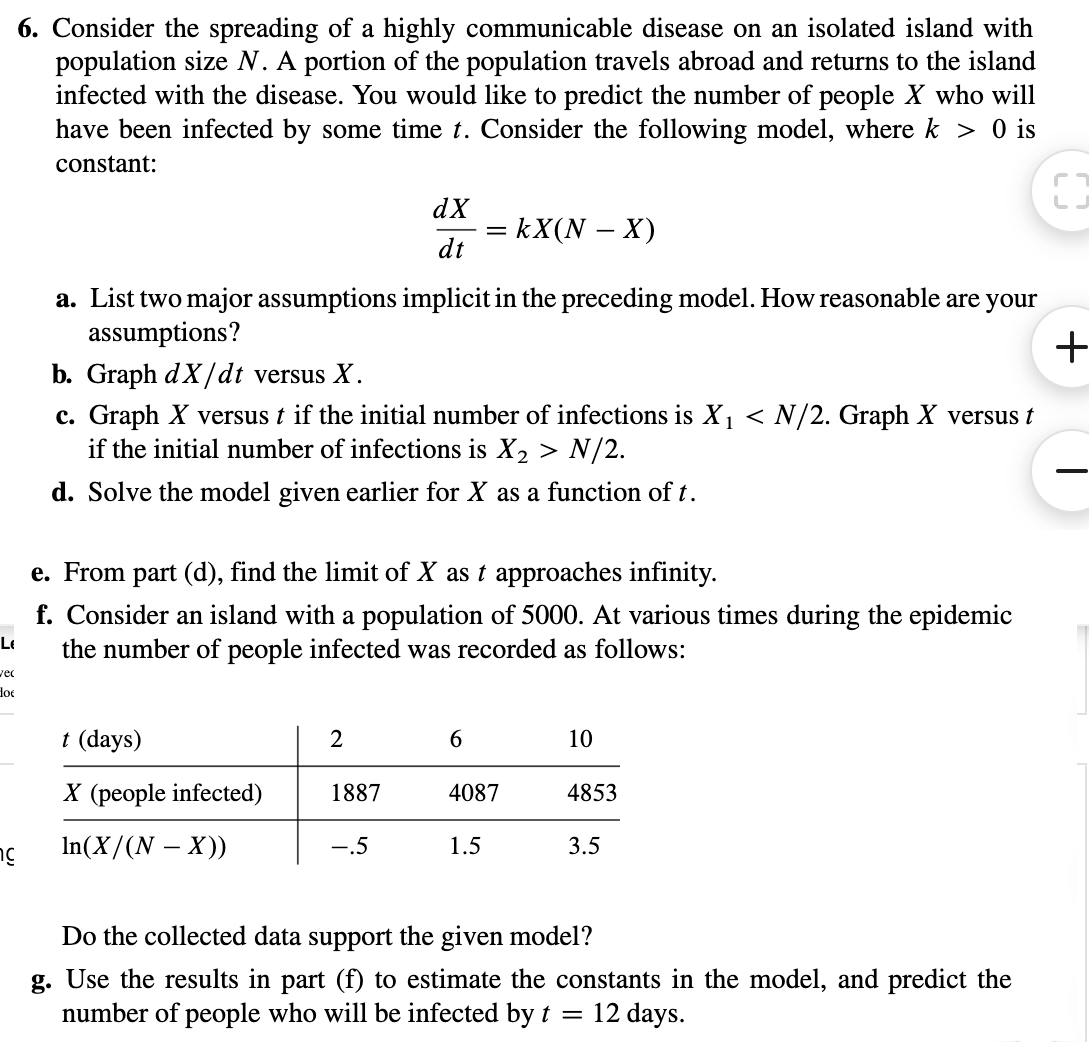
6. Consider the spreading of a highly communicable disease on an isolated island with population size N. A portion of the population travels abroad and returns to the island infected with the disease. You would like to predict the number of people X who will have been infected by some time . Consider the following model, where k > 0 is constant: a. List two major assumptions implicit in the preceding model. How reasonable are your assumptions? b. Graph d X /dt versus X. . Graph X versus if the initial number of infections is X N/2. d. Solve the model given earlier for X as a function of 7. e. From part (d), find the limit of X as approaches infinity. f. Consider an island with a population of 5000. At various times during the epidemic Le the number of people infected was recorded as follows: t (days) 2 6 10 X (people infected) 1887 4087 4853 In(X/(N - X)) -5 1.5 3.5 Do the collected data support the given model? g. Use the results in part (f) to estimate the constants in the model, and predict the number of people who will be infected by + = 12 days
Step by Step Solution
There are 3 Steps involved in it

Get step-by-step solutions from verified subject matter experts