

Question: i did the graph. please answer the questions below these are the options for the graph A. A Flat B. a humped C. Downward sloping
i did the graph. please answer the questions below 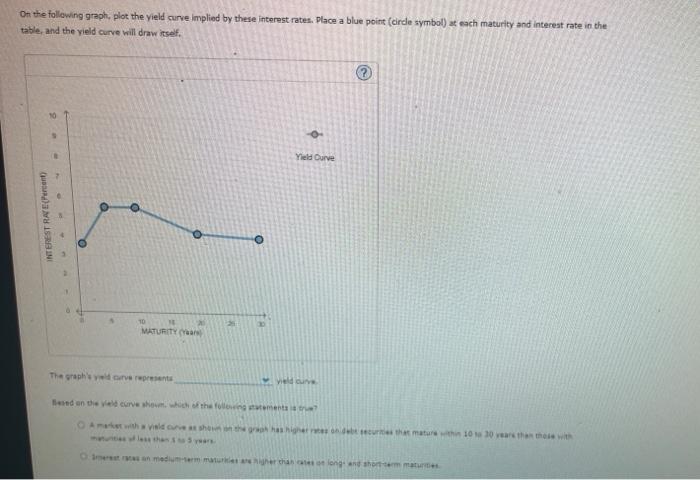
these are the options for the graph
A. A Flat B. a humped C. Downward sloping D. Upward sloping
and then after that please answer the Which statement is true. Thank you
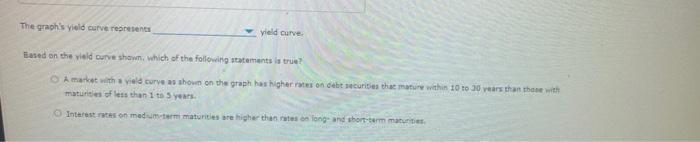
On the following graph, plot the yield curve implied by these interest rates. Place a blue point (circle symbol) at each maturity and interest rate in the tatle, and the yield curve will draw itself. hels curve The quoh's yield curve repretents yeld curve. Eased on the vield olve shawn, which of the following acatements is true?? 2 manket with a viels curve as shown on the graph has highter ratei on debt securises thac mative within 10 to 30 vears than thase with maturisin of less then 1 to 5 years
Step by Step Solution
There are 3 Steps involved in it
1 Expert Approved Answer
Step: 1 Unlock

Question Has Been Solved by an Expert!
Get step-by-step solutions from verified subject matter experts
Step: 2 Unlock
Step: 3 Unlock