

Question: I did this completely wrong please help 3. The following table shows the numbers of patients classified as underweight, normal weight, overweight and obese according
I did this completely wrong please help
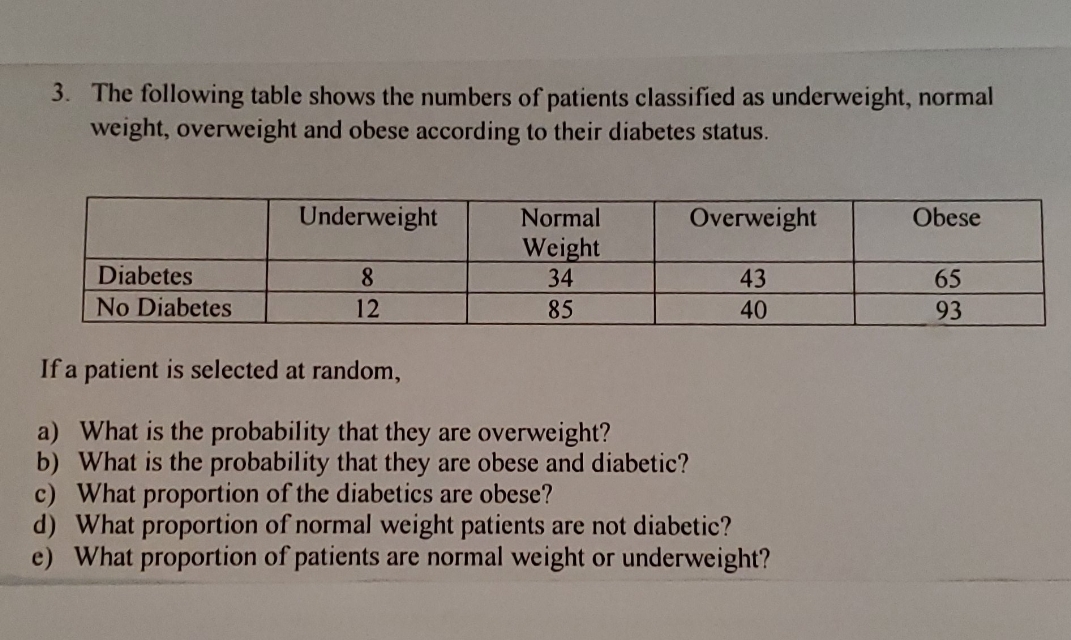
3. The following table shows the numbers of patients classified as underweight, normal weight, overweight and obese according to their diabetes status. Underweight Normal Overweight Obese Weight Diabetes 8 34 43 65 No Diabetes 12 85 40 93 If a patient is selected at random, a) What is the probability that they are overweight? b) What is the probability that they are obese and diabetic? C) What proportion of the diabetics are obese? d) What proportion of normal weight patients are not diabetic? What proportion of patients are normal weight or underweight
Step by Step Solution
There are 3 Steps involved in it
1 Expert Approved Answer
Step: 1 Unlock

Question Has Been Solved by an Expert!
Get step-by-step solutions from verified subject matter experts
Step: 2 Unlock
Step: 3 Unlock