

Question: I do not know if I have done the second and third linear chart correctlly. Would appreciate help with it. Thank you. Add a second
I do not know if I have done the second and third linear chart correctlly. Would appreciate help with it. Thank you.
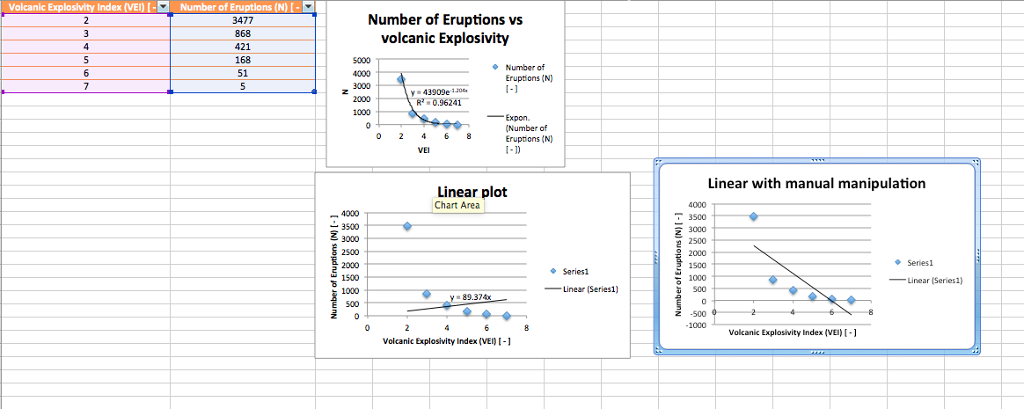
Add a second chart of the function as a linear plot by manipulating the x- and/or y-axes (chart includes title and axis labels including units)
6.Add a third chart of the function as a linear plot by mathematically manipulating the raw data (chart includes title and axis labels including units)
7.How many level 1 volcanoes would you predict to have occurred in the last 10,000 years based on a graphical estimation from any of the three charts? Put your answer in cell A2.
8.How many level 1 volcanoes would you predict to have occurred in the last 10,000 years based on a calculated value using any of the equations from the three charts? Put your calculation in cell A3.
9.What VEI corresponds to a value of 1 eruption per 10,000 years based on a graphical estimation from any of the three charts? Put your answer in cell A4.
.What VEI corresponds to a value of 1 eruption per 10,000 years based on a calculated value using any of the equations from the three charts? Put your calculation in cell A5.
Volcanic Explosivity Index (VEI) [-Number of Eruptions (N) [ Number of Eruptions vs volcanic Explosivity 3477 868 421 168 51 5000 Number of Eruptions (N) 3000 y 43909e1 2000 0.96241- _ Expo. Number of Eruptions (N) 1-1) Linear with manual manipulation Linear plot Chart Area 4000 3500 3000 2500 2000 3500 3000 Senes1 1500 Series! 1000 Linear (Series1) -Linear (Series1) 89.374x 500 Volcanic Explosivity Index (VE) - Volcanic Explosivity Index (VE) -1
Step by Step Solution
There are 3 Steps involved in it

Get step-by-step solutions from verified subject matter experts