

Question: I do not know why I cannot make those points. . Copy your script from problem 1 and delete the second half (counting backwards)-' *
I do not know why I cannot make those points.
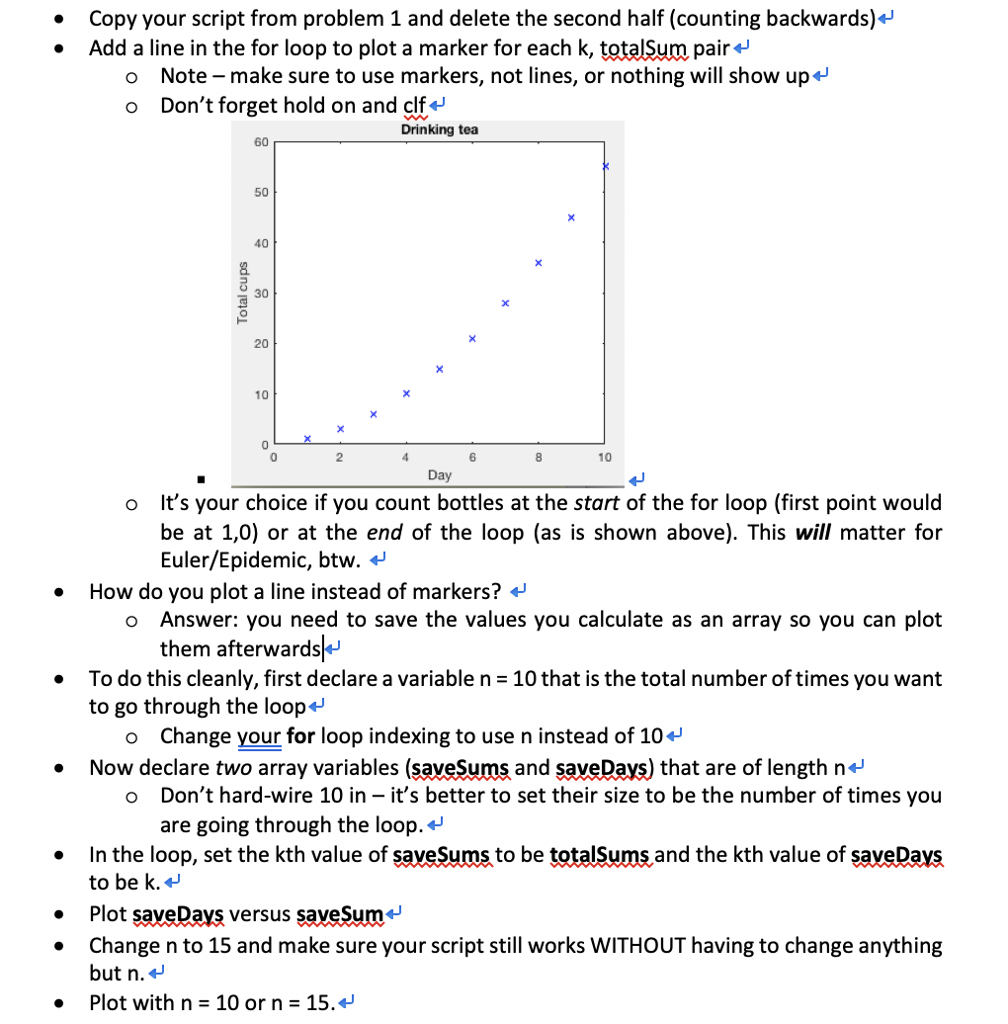
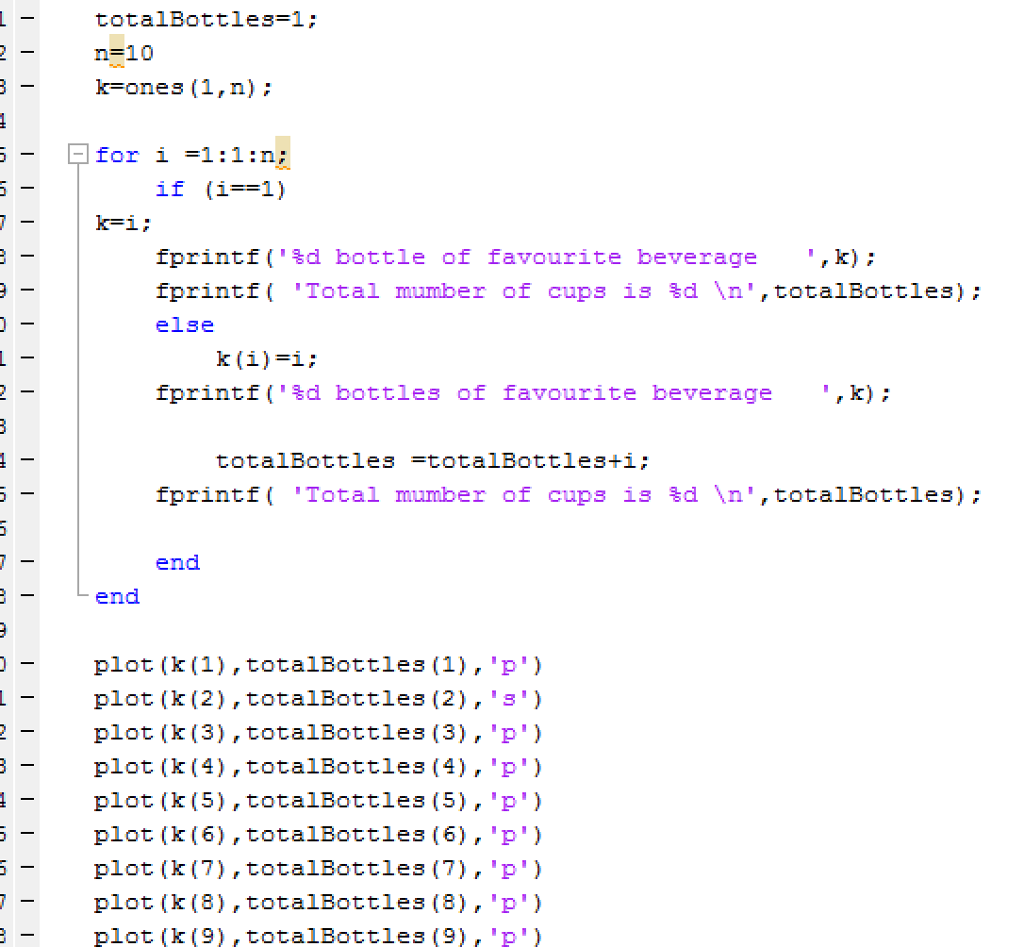
. Copy your script from problem 1 and delete the second half (counting backwards)-' * Add a line in the for loop to plot a marker for each k, totalSum pair+ o Note - make sure to use markers, not lines, or nothing will show up o Don't forget hold on and clf* Drinking tea 60 50 40 30 20 10 0 0 2 6 8 10 Day It's your choice if you count bottles at the start of the for loop (first point would be at 1,0) or at the end of the loop (as is shown above). This will matter for Euler/Epidemic, btw. +' o How do you plot a line instead of markers?+ . o Answer: you need to save the values you calculate as an array so you can plot them afterwards . To do this cleanly, first declare a variable n 10 that is the total number of times you want to go through the loop- o Change your for loop indexing to use n instead of 10 * Now declare two array variables (saveSums and saveDays) that are of length n+ o Don't hard-wire 10 in - it's better to set their size to be the number of times you are going through the loop.+' . In the loop, set the kth value of saveSums to be totalSums and the kth value of saveDays to be k.J * Plot . Change n to 15 and make sure your script still works WITHOUT having to change anything saveDavs versus saveSum* but n. . Plot with n - 10 or n 15. totalBottles-1 n-10 Fones (1,1) ; printf("%d bottle of favourite beverage fprintf( 'Total mumber of cups is %d ", totalBottles); else k) fprintf('%d bottles of favourite beverage totalBottles-totalBottles+i; fprintf( 'Total mumber of cups is %d ', totalBottles); end end plot (k (1),totalBottles (1), 'p') plot (k (2),totalBottles (2), "s') plot (k (3),totalBottles (3),"p') plot (k (4),totalBottles (4),p') plot (k (5),totalBottles (5), "p') plot (k(6), totalBottles (6)p) plot (k(7), totalBottles (7)p) plot (k(8). totalBottles (8)p) plot (k (9), totalBottles (9) p')
Step by Step Solution
There are 3 Steps involved in it

Get step-by-step solutions from verified subject matter experts