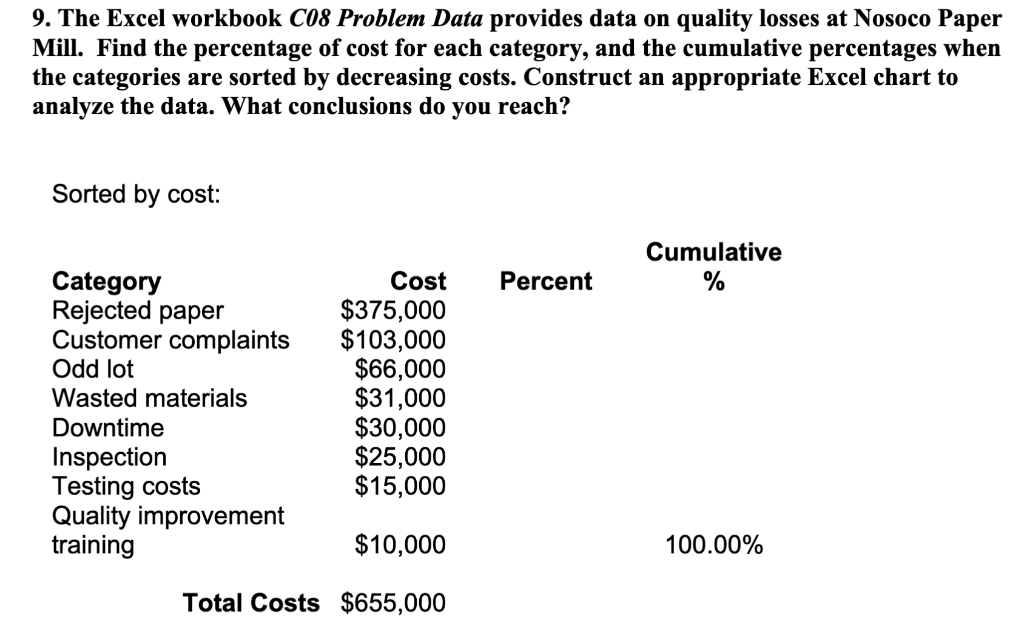
Question: I do not provide p 8 because the problem can be solved using what I am giving. I asked professor :) 9. The Excel workbook

I do not provide p 8 because the problem can be solved using what I am giving. I asked professor :)

I do not provide p 8 because the problem can be

9. The Excel workbook C08 Problem Data provides data on quality losses at Nosoco Paper Mill. Find the percentage of cost for each category, and the cumulative percentages when the categories are sorted by decreasing costs. Construct an appropriate Excel chart to analyze the data. What conclusions do you reach? Sorted by cost

Step by Step Solution

There are 3 Steps involved in it

1 Expert Approved Answer
Step: 1 Unlock blur-text-image
Question Has Been Solved by an Expert!

Get step-by-step solutions from verified subject matter experts

Step: 2 Unlock
Step: 3 Unlock

Students Have Also Explored These Related General Management Questions!