

Question: I do not understand 17 & 19 could you please send an explanation? 11. 12. 0.9798 0.9099 Seat Designs. . In Exercises 13-20, use the
I do not understand 17 & 19 could you please send an explanation?
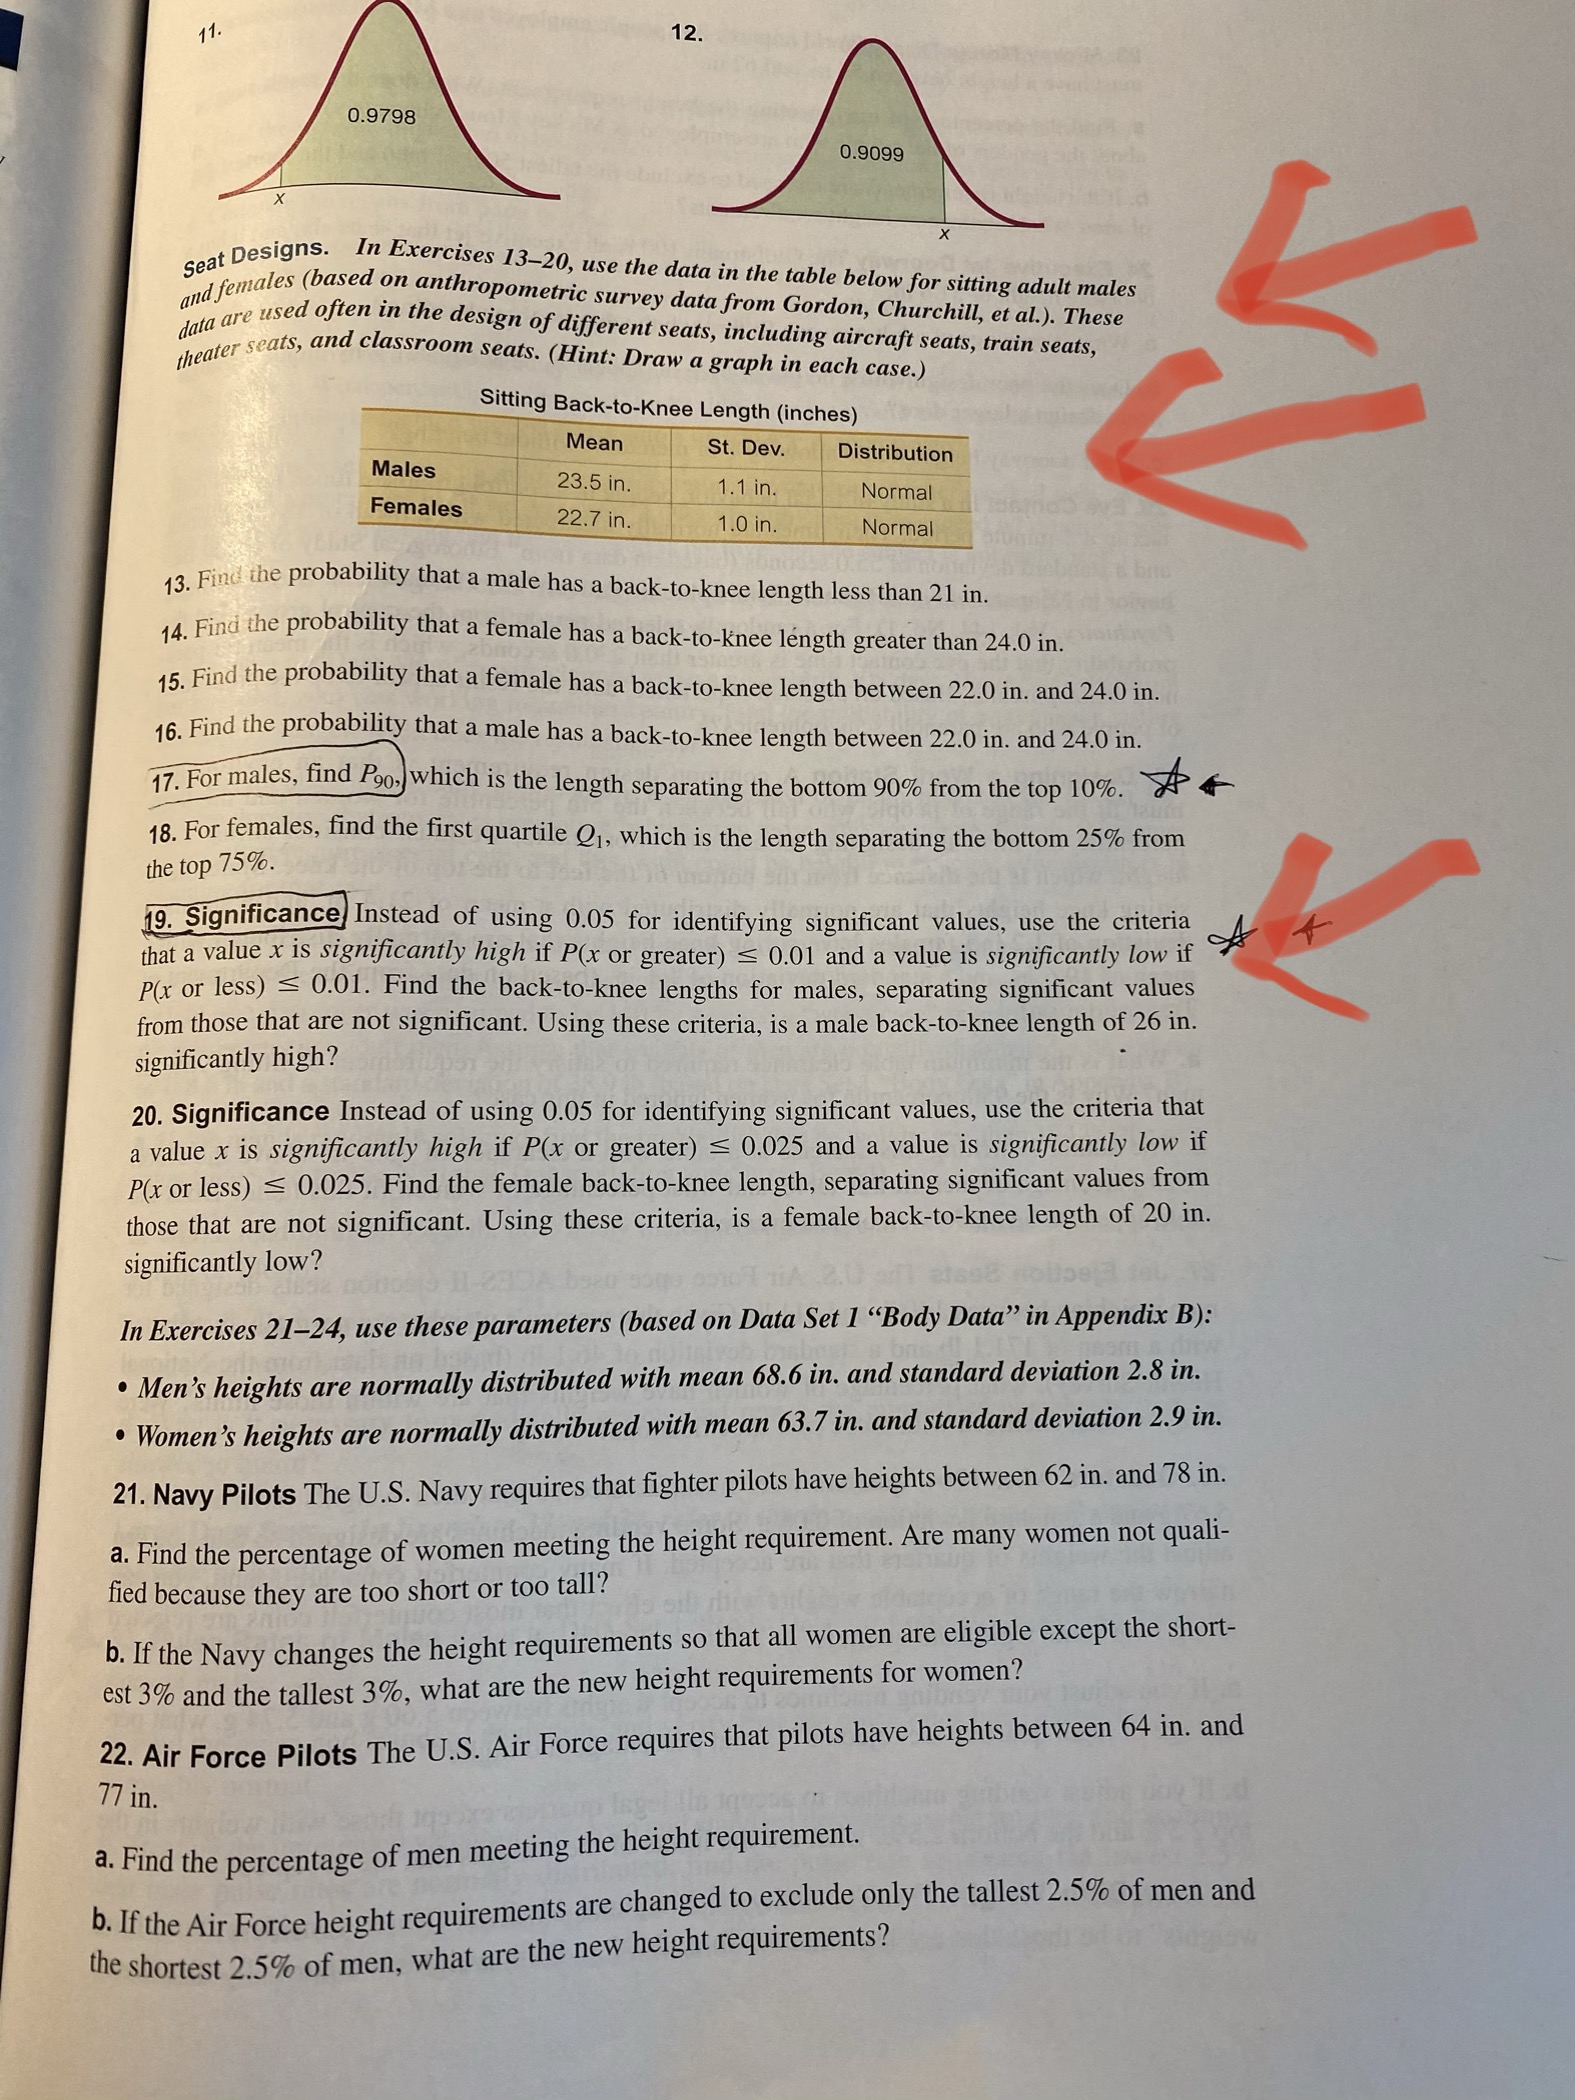
11. 12. 0.9798 0.9099 Seat Designs. . In Exercises 13-20, use the data in the table below for sitting adult males and females (based on anthropometric survey data from Gordon, Churchill, et al.). These data are used often in the design of different seats, including aircraft seats, train seats, theater seats, and classroom seats. (Hint: Draw a graph in each case.) Sitting Back-to-Knee Length (inches Mean Males St. Dev. Distribution 23.5 in. Females 1.1 in. Normal 22.7 in . 1.0 in. Normal 13. Find the probability that a male has a back-to-knee length less than 21 in. 14. Find the probability that a female has a back-to-knee length greater than 24.0 in. 15. Find the probability that a female has a back-to-knee length between 22.0 in. and 24.0 in. 16. Find the probability that a male has a back-to-knee length between 22.0 in. and 24.0 in. 17. For males, find Poo, which is the length separating the bottom 90% from the top 10%. the top 75%. 18. For females, find the first quartile @1, which is the length separating the bottom 25% from 19. Significance Instead of using 0.05 for identifying significant values, use the criteria that a value x is significantly high if P(x or greater) = 0.01 and a value is significantly low if P(x or less) = 0.01. Find the back-to-knee lengths for males, separating significant values from those that are not significant. Using these criteria, is a male back-to-knee length of 26 in. significantly high? 20. Significance Instead of using 0.05 for identifying significant values, use the criteria that a value x is significantly high if P(x or greater) = 0.025 and a value is significantly low if P(x or less) = 0.025. Find the female back-to-knee length, separating significant values from those that are not significant. Using these criteria, is a female back-to-knee length of 20 in. significantly low? In Exercises 21-24, use these parameters (based on Data Set 1 "Body Data" in Appendix B): . Men's heights are normally distributed with mean 68.6 in. and standard deviation 2.8 in. . Women's heights are normally distributed with mean 63.7 in. and standard deviation 2.9 in. 21. Navy Pilots The U.S. Navy requires that fighter pilots have heights between 62 in. and 78 in. a. Find the percentage of women meeting the height requirement. Are many women not quali- fied because they are too short or too tall? b. If the Navy changes the height requirements so that all women are eligible except the short- est 3% and the tallest 3%, what are the new height requirements for women? 22. Air Force Pilots The U.S. Air Force requires that pilots have heights between 64 in. and 77 in. a. Find the percentage of men meeting the height requirement. b. If the Air Force height requirements are changed to exclude only the tallest 2.5% of men and the shortest 2.5% of men, what are the new height requirements
Step by Step Solution
There are 3 Steps involved in it

Get step-by-step solutions from verified subject matter experts