

Question: I do not understand how to do these problems and would appreciate if someone can help me out and show me how to do them
I do not understand how to do these problems and would appreciate if someone can help me out and show me how to do them please!
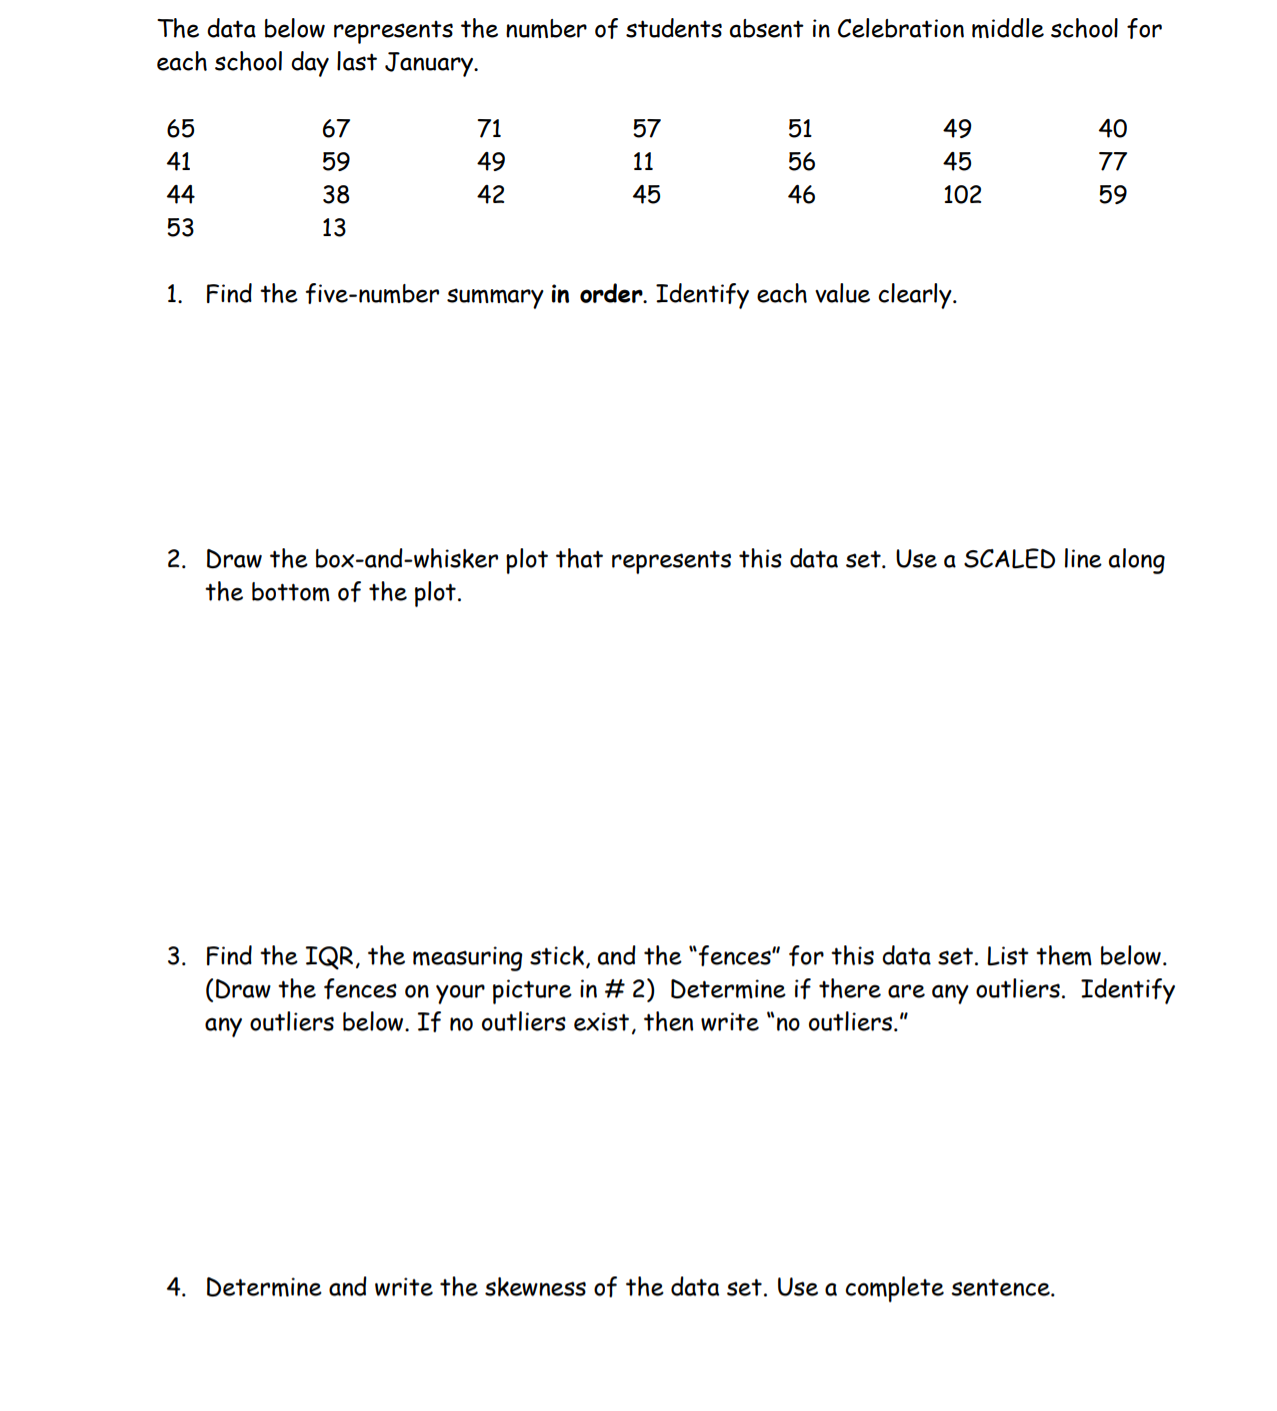
The data below represents the number of students absent in Celebration middle school for each school day last January. 65 41 44 53 1. 67 71 57 51 49 40 59 49 11 56 45 77 38 42 45 46 102 59 13 Find the five-number Summary in order. Identify each value clearly. 2. Draw the box-and-whisker plot that repreSents this data Set. USe a SCALED line along the bottom of the plot. 3. Find the IQR, the measuring stick, and the \"fences" for this data set. List them below. (Draw the fences on your picture in # 2) Determine if there are any outliers. Identify any outliers below. If no outliers exist, then write "no outliers.\" 4. Determine and write the skewness of the data set. Use a complete sentence
Step by Step Solution
There are 3 Steps involved in it

Get step-by-step solutions from verified subject matter experts