

Question: I do not understand this; at all!!! Can you explain it in statistics for dummies style? Thank you so much, this is a pretest practice
I do not understand this; at all!!! Can you explain it in statistics for dummies style? Thank you so much, this is a pretest practice sheet.
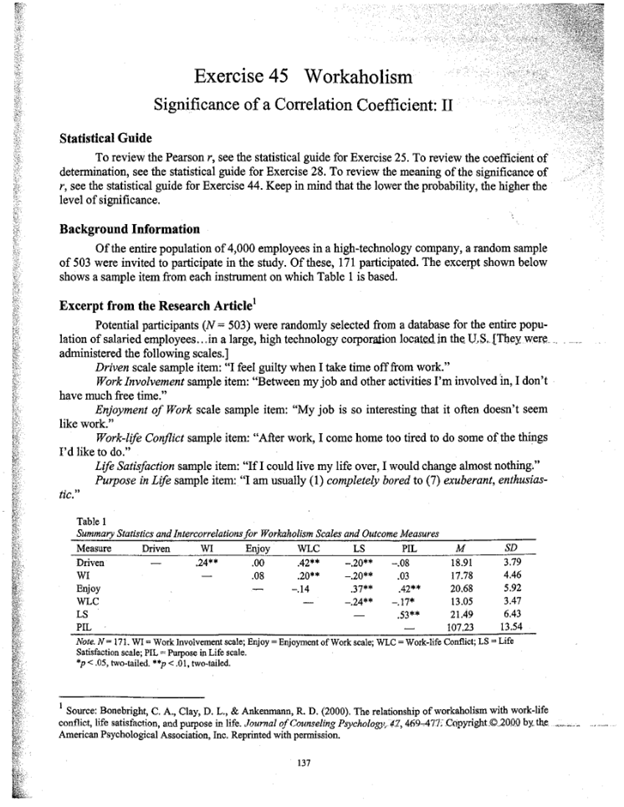
Exercise 45 Workaholicm: Significance of a Correlation Coefficient: II 10. How many of the correlations with "PIL" are statistically significant? Part B: Questions for Discussion 11. Does it surprise you that some of the negative correlation coefficients are statistically signifi- cant? Explain. 12. The correlation between "WI" and "LS" is-20, which in this study is statistically significant. Would you characterize this relationship as being "very strong"? Explain. 13. Are the values in the column labeled "M" correlation coefficients? Explain. 14. Does it surprise you that the relationship between "Life Satisfaction" and "Purpose in Life" is statistically significant? Explain. 139Exercise 45 Workaholicm: Significance of a Correlation Coefficient: II Questions for Exercise 45 Part A: Factual Questions 1. What is the correlation coefficient for the relationship between "Life Satisfaction" and "Purpose in Life"? 2. What are the names of the two scales between which there is the weakest correlation? 3. Is the correlation coefficient for the relationship between "Enjoyment of Work" and "Purpose in Life" statistically significant? If yes, at what probability level is it significant? 4. The relationship between "WLC" and "LS" is such that those who have high "WLC" scores tend to have A. high "LS" scores. B. low "LS" scores. 5. "Driven" has insignificant relationships with which other variables? Identify them by their ab- breviations. 6. There are 10 statistically significant correlation coefficients in the table. Are they all significant at the same level of significance? Explain. 7. Should the null hypothesis for the relationship between "WI" and "LS" be rejected? Explain. 8. What is the probability that the correlation for the relationship between "Enjoy" and "PIL" is a chance deviation (due to random sampling errors) from 0.00? 9. In statistics, a Type I error is the error of rejecting the null hypothesis when, in truth, it is correct. If we reject the null hypothesis regarding the relationship between "Driven" and "WI," what is the probability that we are making a Type I error? 138Exercise 45 Workaholicm Significance of a Correlation Coefficient: II Statistical Guide To review the Pearson r, see the statistical guide for Exercise 25. To review the coefficient of determination, see the statistical guide for Exercise 28. To review the meaning of the significance of r, see the statistical guide for Exercise 44. Keep in mind that the lower the probability, the higher the level of significance. Background Information Of the entire population of 4,000 employees in a high-technology company, a random sample of 503 were invited to participate in the study. Of these, 171 participated. The excerpt shown below shows a sample item from each instrument on which Table 1 is based. Excerpt from the Research Article' Potential participants (NV = 503) were randomly selected from a database for the entire popu- lation of salaried employees...in a large, high technology corporation located in the U.S. [They were. . administered the following scales.] Driven scale sample item: "I feel guilty when I take time off from work." Work Involvement sample item: "Between my job and other activities I'm involved in, I don't have much free time." Enjoyment of Work scale sample item: "My job is so interesting that it often doesn't seem like work." Work-life Conflict sample item: "After work, I come home too tired to do some of the things I'd like to do." Life Satisfaction sample item: "If I could live my life over, I would change almost nothing." Purpose in Life sample item: "I am usually (1) completely bored to (7) exuberant, enthusias- tic." Table I Summary Statistics and Intercorrelations for Workaholicm Scales and Outcome Measures Measure Driven WI Enjoy WLC LS PIL M SD Driven 24 420 .08 18.91 3.79 WI 08 -.20" 03 17.78 4.46 Enjoy -14 37. 424 20.68 5.92 WLC 17 13.05 3.47 LS 21.49 6.43 PIL 107.23 13.54 Note. N- 171. WI = Work Involvement scale, Enjoy = Enjoyment of Work scale, WLC = Work-life Conflict; LS - Life Satisfaction scale; PIL - Purpose in Life scale. "p <.05 two-tailed. source: bonebright c. a. clay d. l. ankenmann r. the relationship of workaholicm with work-life conflict life satisfaction and purpose in life. journal counseling psychology copyright by american psychological association inc. reprinted permission.>
Step by Step Solution
There are 3 Steps involved in it

Get step-by-step solutions from verified subject matter experts