

Question: I do not understand this problem please help me out with this problem The following table lists Major League Baseball's (MLB's) leading pitchers, their earned
I do not understand this problem please help me out with this problem
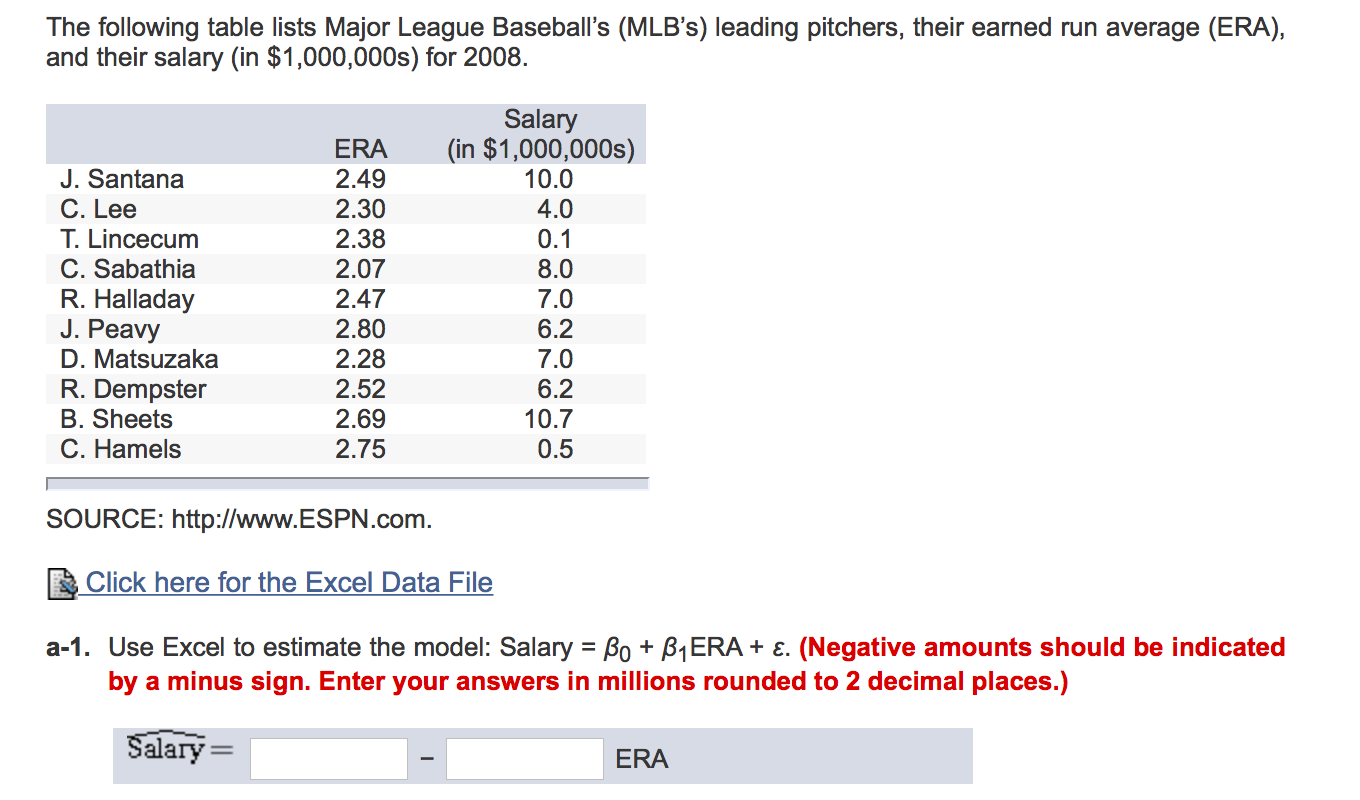
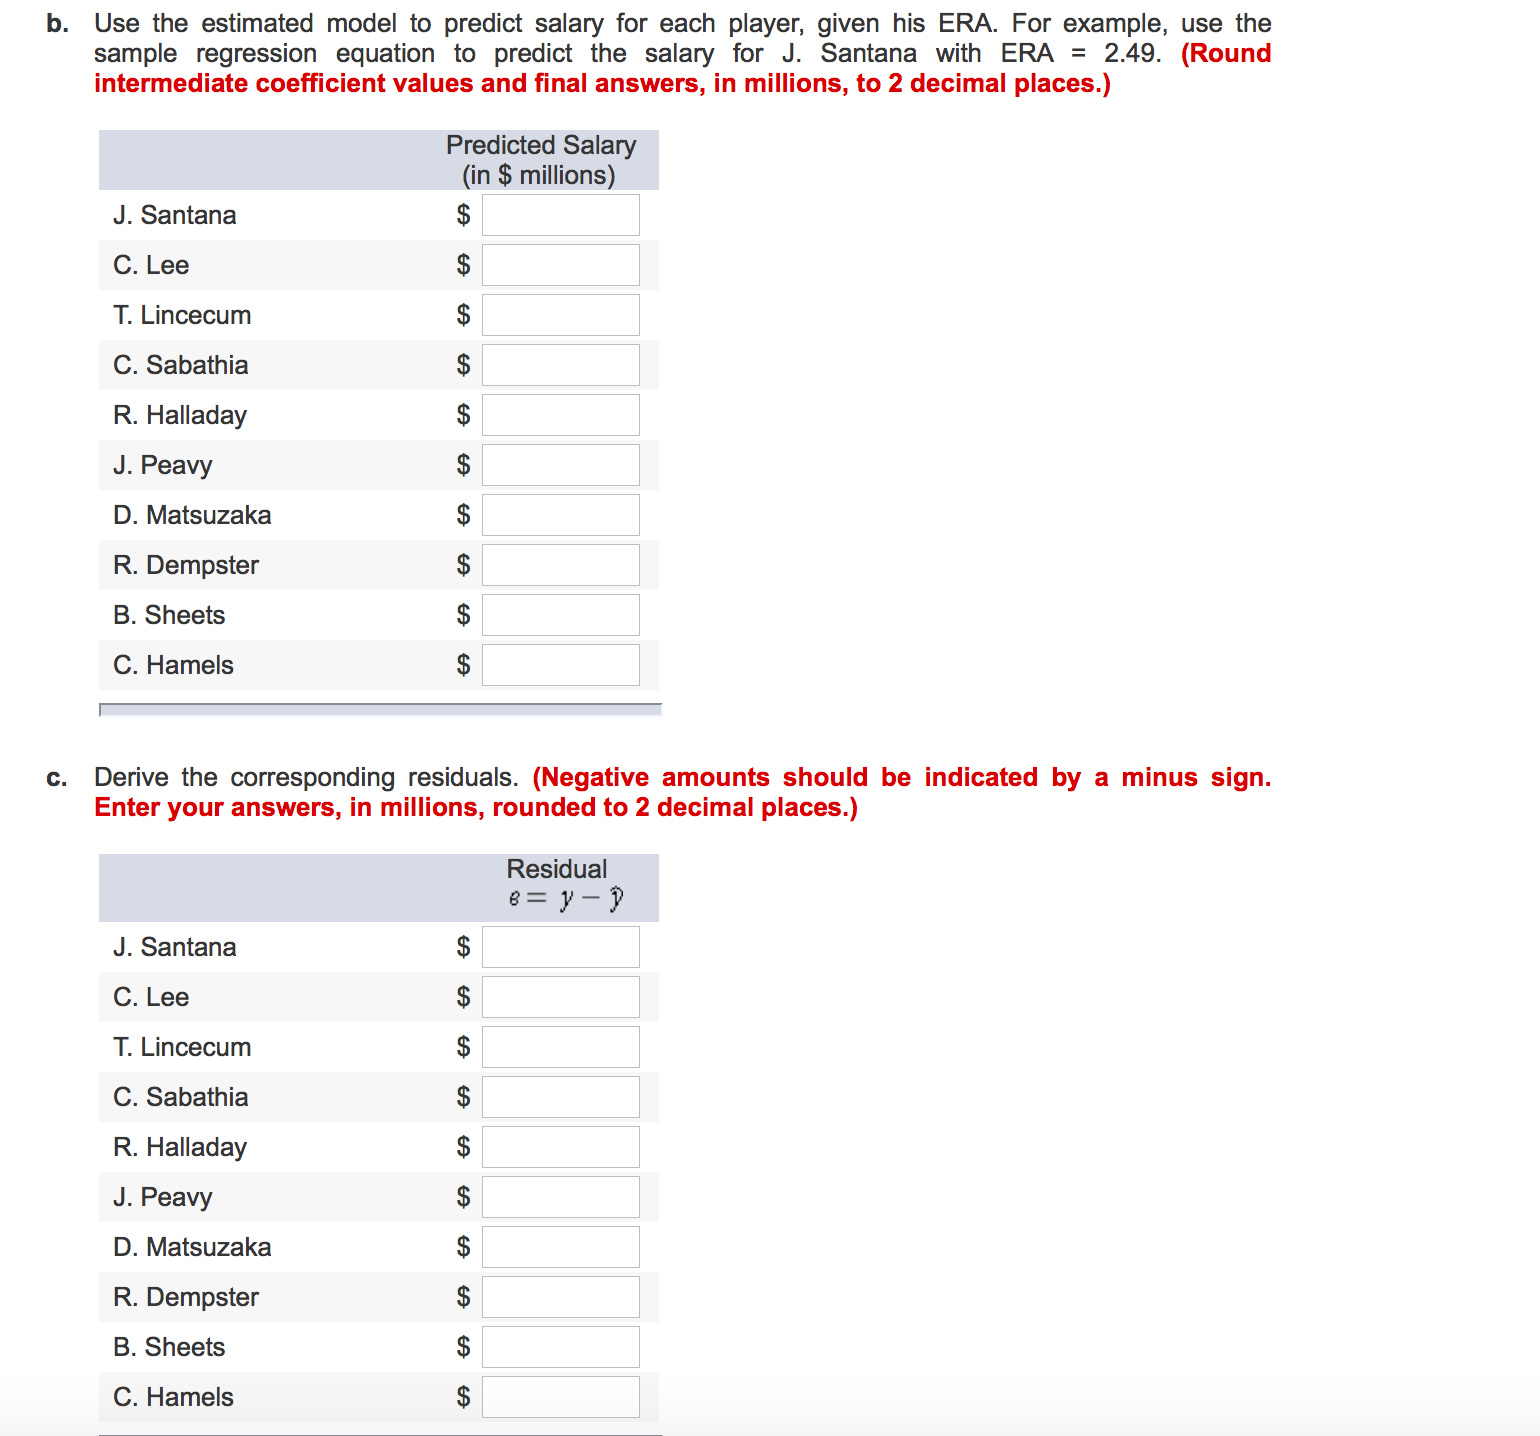
The following table lists Major League Baseball's (MLB's) leading pitchers, their earned run average (ERA), and their salary (in $1 ,000,0005) for 2008. Salary ERA (in $1 ,000.000$) J. Santana 2.49 10.0 C. Lee 2.30 4.0 T. Lincecum 2.38 0.1 C. Sabathia 2.07 8.0 R. Halladay 2.47 7.0 J. Peavy 2.80 6.2 D. Matsuzaka 2.28 7.0 R. Dempster 2.52 6.2 B. Sheets 2.69 10.7 C. Hamels 2.75 0.5 SOURCE: http:!Iwww.ESPN.com. Click here for the Excel Data File a-1. Use Excel to estimate the model: Salary = Bo + [31 ERA + 5. (Negative amounts should be indicated by a minus sign. Enter your answers in millions rounded to 2 decimal places.) m= ERA b. Use the estimated model to predict salary for each player, given his ERA. For example, use the sample regression equation to predict the salary for J. Santana with ERA = 2.49. (Round intermediate coefcient values and final answers, in millions, to 2 decimal places.) Predicted Salary (in $ millions) J. Santana $ C. Lee T. Lincecum C. Sabathia R. Halladay J. Peavy D. Matsuzaka R. Dempster B. Sheets C. Hamels mmmmmmmmm c. Derive the corresponding residuals. (Negative amounts should be indicated by a minus sign. Enter your answers, in millions, rounded to 2 decimal places.) Residual 6* = F - JP J. Santana C. Lee T. Lincecum C. Sabathia R. Halladay J. Peavy D. Matsuzaka R. Dempster B. Sheets $$$$$$$$$$ C. Hamels
Step by Step Solution
There are 3 Steps involved in it

Get step-by-step solutions from verified subject matter experts