Question: I do not want you to solve this problem by using MINITAB. I want you to solve it by using R. Also, you should show

 I do not want you to solve this problem by using MINITAB. I want you to solve it by using R. Also, you should show me all your work. For example you should show me your output and code step by step.
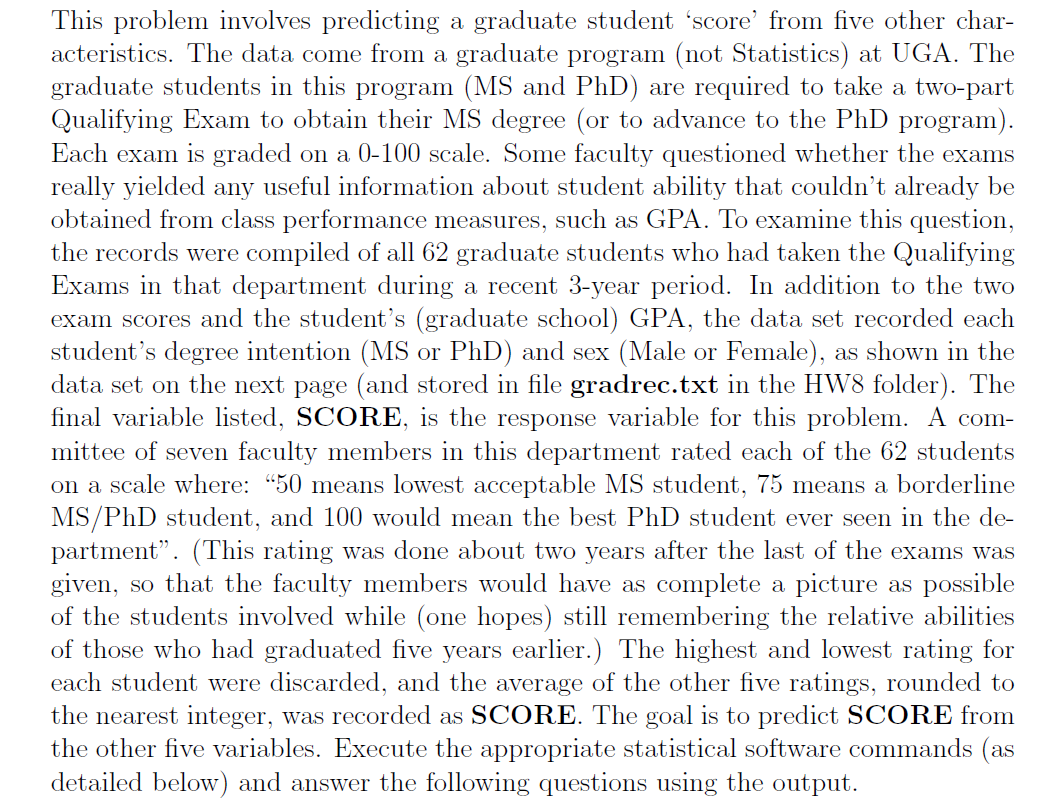
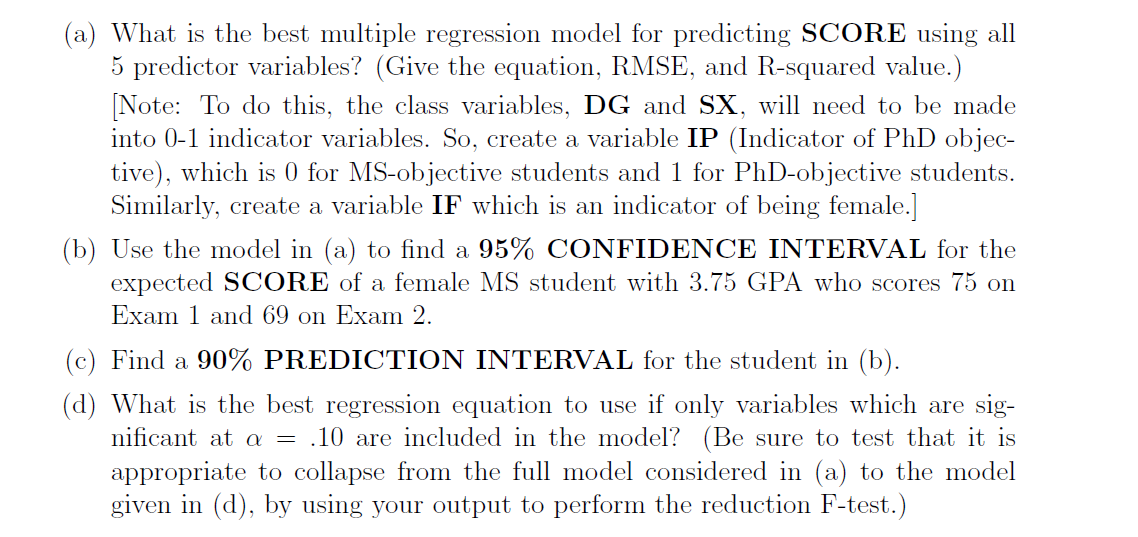
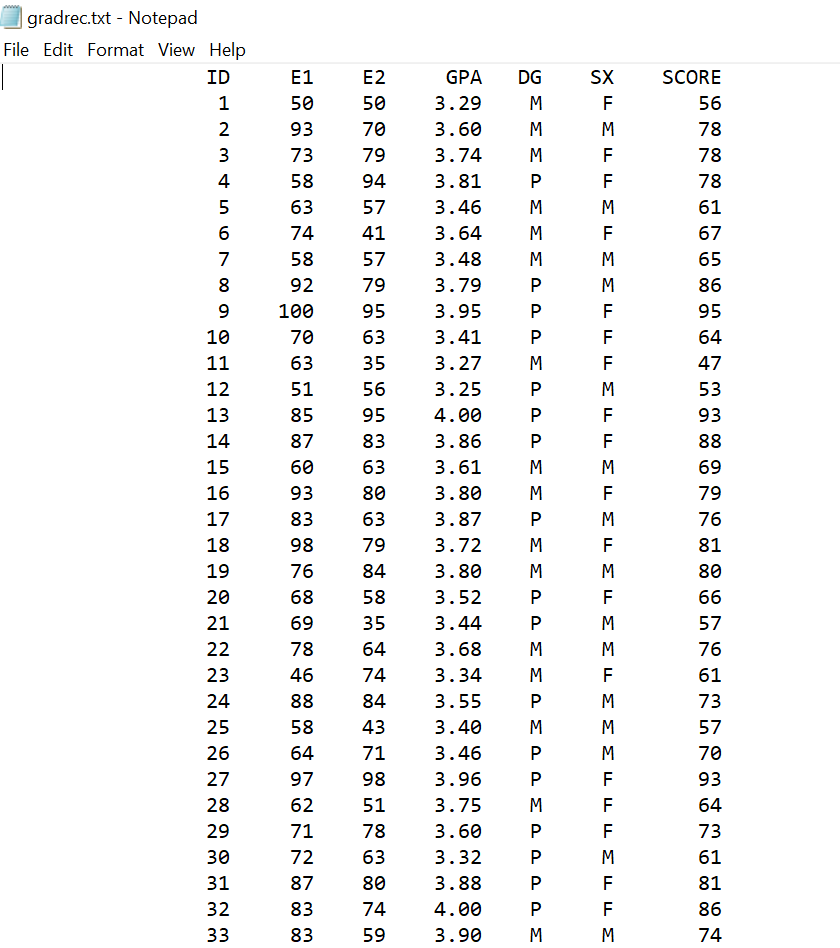
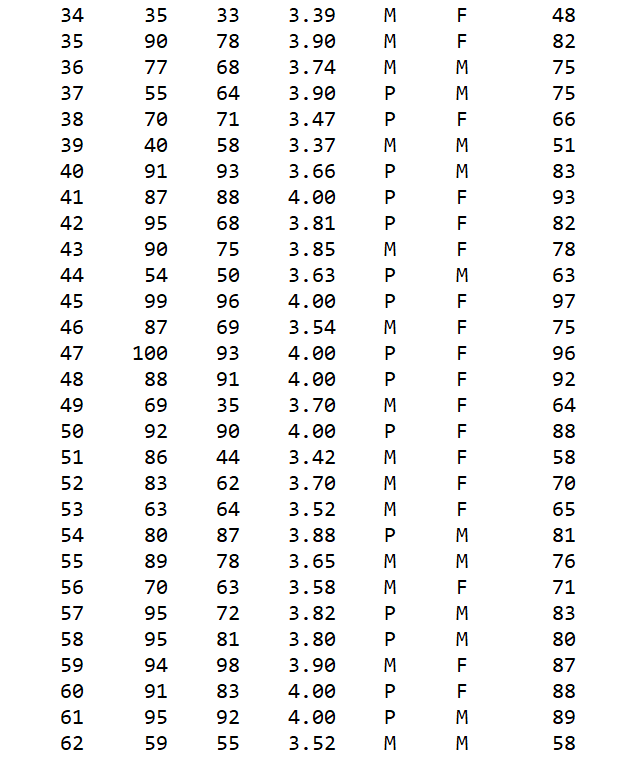
This problem involves predicting a graduate student score' from five other char- acteristics. The data come from a graduate program (not Statistics) at UGA. The graduate students in this program (MS and PhD) are required to take a two-part Qualifying Exam to obtain their MS degree (or to advance to the PhD program). Each exam is graded on a 0-100 scale. Some faculty questioned whether the exams really yielded any useful information about student ability that couldn't already be obtained from class performance measures, such as GPA. To examine this question, the records were compiled of all 62 graduate students who had taken the Qualifying Exams in that department during a recent 3-year period. In addition to the two exam scores and the student's (graduate school) GPA, the data set recorded each student's degree intention (MS or PhD) and sex (Male or Female), as shown in the data set on the next page (and stored in file gradrec.txt in the HW8 folder). The final variable listed, SCORE, is the response variable for this problem. A com- mittee of seven faculty members in this department rated each of the 62 students on a scale where: 50 means lowest acceptable MS student, 75 means a borderline MS/PhD student, and 100 would mean the best PhD student ever seen in the de- partment. (This rating was done about two years after the last of the exams was given, so that the faculty members would have as complete a picture as possible of the students involved while (one hopes) still remembering the relative abilities of those who had graduated five years earlier.) The highest and lowest rating for each student were discarded, and the average of the other five ratings, rounded to the nearest integer, was recorded as SCORE. The goal is to predict SCORE from the other five variables. Execute the appropriate statistical software commands (as detailed below) and answer the following questions using the output. (a) What is the best multiple regression model for predicting SCORE using all 5 predictor variables? (Give the equation, RMSE, and R-squared value.) [Note: To do this, the class variables, DG and SX, will need to be made into 0-1 indicator variables. So, create a variable IP (Indicator of PhD objec- tive), which is 0 for MS-objective students and 1 for PhD-objective students. Similarly, create a variable IF which is an indicator of being female.] (b) Use the model in (a) to find 95% CONFIDENCE INTERVAL for the expected SCORE of a female MS student with 3.75 GPA who scores 75 on Exam 1 and 69 on Exam 2. (c) Find a 90% PREDICTION INTERVAL for the student in (b). (d) What is the best regression equation to use if only variables which are sig- nificant at a = .10 are included in the model? (Be sure to test that it is appropriate to collapse from the full model considered in (a) to the model given in (d), by using your output to perform the reduction F-test.) (e) Examine the plot of residuals vs. predicted values for the model in question (d) and comment on the appropriateness of the model. E1 SX E2 50 70 DG M M . M M M F 50 93 73 58 63 74 58 92 100 70 M F M M 63 gradrec.txt - Notepad File Edit Format View Help ID 1 2 3 4 5 6 7 8 9 10 11 12 13 14 15 16 17 18 19 20 21 22 23 24 25 26 27 28 29 30 31 32 33 F 79 94 57 41 57 79 95 63 35 56 95 83 63 80 63 79 84 58 35 64 74 84 43 71 98 51 78 63 80 74 59 M M M M P M M GPA 3.29 3.60 3.74 3.81 3.46 3.64 3.48 3.79 3.95 3.41 3.27 3.25 4.00 3.86 3.61 3.80 3.87 3.72 3.80 3.52 3.44 3.68 3.34 3.55 3.40 3.46 3.96 3.75 3.60 3.32 3.88 4.00 3.90 51 85 87 60 93 83 98 76 68 69 78 46 88 58 64 97 62 71 72 87 83 83 3 3 3 3 : 3 3 3 3 3 3 3 3 : 3 3 3 3 3 T 3 3 T SCORE 56 78 78 78 61 67 65 86 95 64 47 53 93 88 69 79 76 81 80 66 57 76 61 73 57 70 93 64 73 61 81 86 74 M F A A A E M F M M mmm F 33 78 68 M M M F 64 71 58 93 88 68 75 3 3 3 3 3 T 3 M F F 50 M F 96 69 93 34 35 36 37 38 39 40 41 42 43 44 45 46 47 48 49 50 51 52 53 54 55 56 57 58 59 60 61 62 35 90 77 55 70 40 91 87 95 90 54 99 87 100 88 69 92 86 83 63 80 89 70 95 95 94 91 95 59 91 3.39 3.90 3.74 3.90 3.47 3.37 3.66 4.00 3.81 3.85 3.63 4.00 3.54 4.00 4.00 3.70 4.00 3.42 3.70 3.52 3.88 3.65 3.58 3.82 3.80 3.90 4.00 4.00 3.52 3 3 3 3 3 3 3 3 3 3 3 3 3 3 F F 48 82 75 75 66 51 83 93 82 78 63 97 75 96 92 64 88 58 70 65 81 76 71 83 80 87 88 89 58 M 35 90 44 62 64 87 78 63 72 81 98 83 92 55 3 3 3 3 3 3 F F M M F M M M F M M M This problem involves predicting a graduate student score' from five other char- acteristics. The data come from a graduate program (not Statistics) at UGA. The graduate students in this program (MS and PhD) are required to take a two-part Qualifying Exam to obtain their MS degree (or to advance to the PhD program). Each exam is graded on a 0-100 scale. Some faculty questioned whether the exams really yielded any useful information about student ability that couldn't already be obtained from class performance measures, such as GPA. To examine this question, the records were compiled of all 62 graduate students who had taken the Qualifying Exams in that department during a recent 3-year period. In addition to the two exam scores and the student's (graduate school) GPA, the data set recorded each student's degree intention (MS or PhD) and sex (Male or Female), as shown in the data set on the next page (and stored in file gradrec.txt in the HW8 folder). The final variable listed, SCORE, is the response variable for this problem. A com- mittee of seven faculty members in this department rated each of the 62 students on a scale where: 50 means lowest acceptable MS student, 75 means a borderline MS/PhD student, and 100 would mean the best PhD student ever seen in the de- partment. (This rating was done about two years after the last of the exams was given, so that the faculty members would have as complete a picture as possible of the students involved while (one hopes) still remembering the relative abilities of those who had graduated five years earlier.) The highest and lowest rating for each student were discarded, and the average of the other five ratings, rounded to the nearest integer, was recorded as SCORE. The goal is to predict SCORE from the other five variables. Execute the appropriate statistical software commands (as detailed below) and answer the following questions using the output. (a) What is the best multiple regression model for predicting SCORE using all 5 predictor variables? (Give the equation, RMSE, and R-squared value.) [Note: To do this, the class variables, DG and SX, will need to be made into 0-1 indicator variables. So, create a variable IP (Indicator of PhD objec- tive), which is 0 for MS-objective students and 1 for PhD-objective students. Similarly, create a variable IF which is an indicator of being female.] (b) Use the model in (a) to find 95% CONFIDENCE INTERVAL for the expected SCORE of a female MS student with 3.75 GPA who scores 75 on Exam 1 and 69 on Exam 2. (c) Find a 90% PREDICTION INTERVAL for the student in (b). (d) What is the best regression equation to use if only variables which are sig- nificant at a = .10 are included in the model? (Be sure to test that it is appropriate to collapse from the full model considered in (a) to the model given in (d), by using your output to perform the reduction F-test.) (e) Examine the plot of residuals vs. predicted values for the model in question (d) and comment on the appropriateness of the model. E1 SX E2 50 70 DG M M . M M M F 50 93 73 58 63 74 58 92 100 70 M F M M 63 gradrec.txt - Notepad File Edit Format View Help ID 1 2 3 4 5 6 7 8 9 10 11 12 13 14 15 16 17 18 19 20 21 22 23 24 25 26 27 28 29 30 31 32 33 F 79 94 57 41 57 79 95 63 35 56 95 83 63 80 63 79 84 58 35 64 74 84 43 71 98 51 78 63 80 74 59 M M M M P M M GPA 3.29 3.60 3.74 3.81 3.46 3.64 3.48 3.79 3.95 3.41 3.27 3.25 4.00 3.86 3.61 3.80 3.87 3.72 3.80 3.52 3.44 3.68 3.34 3.55 3.40 3.46 3.96 3.75 3.60 3.32 3.88 4.00 3.90 51 85 87 60 93 83 98 76 68 69 78 46 88 58 64 97 62 71 72 87 83 83 3 3 3 3 : 3 3 3 3 3 3 3 3 : 3 3 3 3 3 T 3 3 T SCORE 56 78 78 78 61 67 65 86 95 64 47 53 93 88 69 79 76 81 80 66 57 76 61 73 57 70 93 64 73 61 81 86 74 M F A A A E M F M M mmm F 33 78 68 M M M F 64 71 58 93 88 68 75 3 3 3 3 3 T 3 M F F 50 M F 96 69 93 34 35 36 37 38 39 40 41 42 43 44 45 46 47 48 49 50 51 52 53 54 55 56 57 58 59 60 61 62 35 90 77 55 70 40 91 87 95 90 54 99 87 100 88 69 92 86 83 63 80 89 70 95 95 94 91 95 59 91 3.39 3.90 3.74 3.90 3.47 3.37 3.66 4.00 3.81 3.85 3.63 4.00 3.54 4.00 4.00 3.70 4.00 3.42 3.70 3.52 3.88 3.65 3.58 3.82 3.80 3.90 4.00 4.00 3.52 3 3 3 3 3 3 3 3 3 3 3 3 3 3 F F 48 82 75 75 66 51 83 93 82 78 63 97 75 96 92 64 88 58 70 65 81 76 71 83 80 87 88 89 58 M 35 90 44 62 64 87 78 63 72 81 98 83 92 55 3 3 3 3 3 3 F F M M F M M M F M M M


