

Question: I don't know how to show the data in this wabsite. 1. (20 points) For this exercise, you will use the social mobility. csv file
I don't know how to show the data in this wabsite.
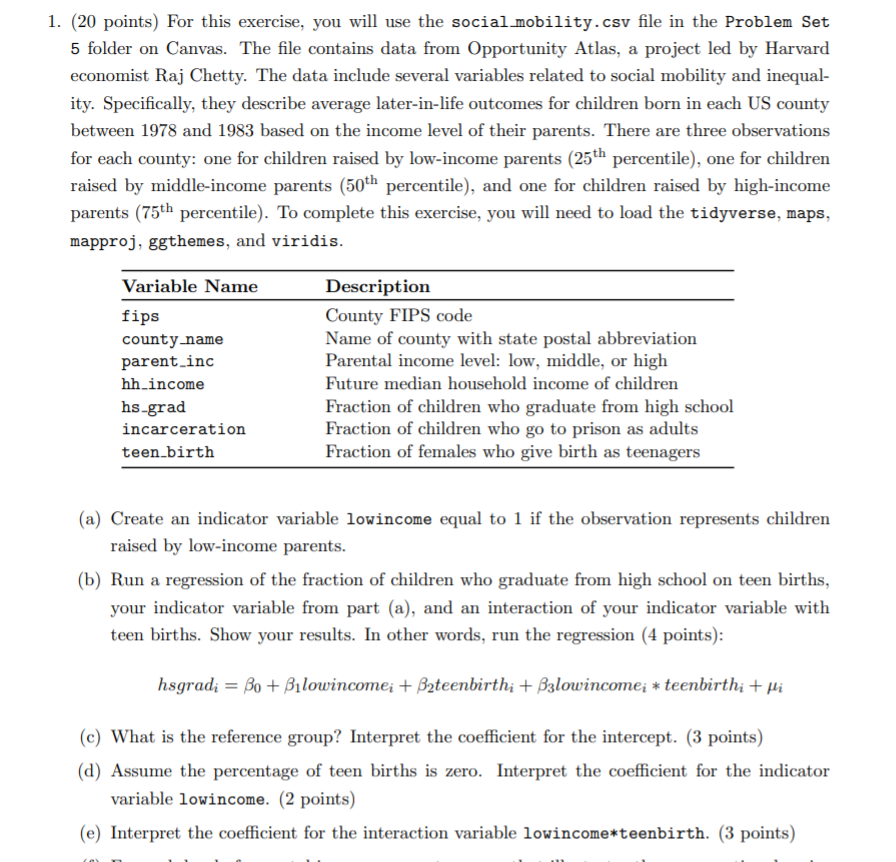

1. (20 points) For this exercise, you will use the social mobility. csv file in the Problem Set 5 folder on Canvas. The file contains data from Opportunity Atlas, a project led by Harvard economist Raj Chetty. The data include several variables related to social mobility and inequal- ity. Specifically, they describe average later-in-life outcomes for children born in each US county between 1978 and 1983 based on the income level of their parents. There are three observations for each county: one for children raised by low-income parents (25th percentile), one for children raised by middle-income parents (50th percentile), and one for children raised by high-income parents (75th percentile). To complete this exercise, you will need to load the tidyverse, maps, mapproj, ggthemes, and viridis. Variable Name Description fips County FIPS code county name Name of county with state postal abbreviation parent_inc Parental income level: low, middle, or high hh_income Future median household income of children hs_grad Fraction of children who graduate from high school incarceration Fraction of children who go to prison as adults teen_birth Fraction of females who give birth as teenagers (a) Create an indicator variable lowincome equal to 1 if the observation represents children raised by low-income parents. (b) Run a regression of the fraction of children who graduate from high school on teen births, your indicator variable from part (a), and an interaction of your indicator variable with teen births. Show your results. In other words, run the regression (4 points): hsgradi = Bo + Bilowincome; + Byteenbirthi + Balowincome; * teenbirth; + fi (c) What is the reference group? Interpret the coefficient for the intercept. (3 points) (d) Assume the percentage of teen births is zero. Interpret the coefficient for the indicator variable lowincome. (2 points) (e) Interpret the coefficient for the interaction variable lowincome*teenbirth. (3 points)(f) For each level of parental income, generate a map that illustrates the cross-sectional varia- tion in teenage birth rates. To facilitate comparisons between your maps, use the limits I as (lower . upper) argument in the scalaiilLviridis function. Note: lower and upper are placeholders for actual numbers. (4 points) {3] Provide a thorough discussion of your maps. What do they show? Do any interesting patterns emerge? Explain. (4 points)
Step by Step Solution
There are 3 Steps involved in it

Get step-by-step solutions from verified subject matter experts