

Question: I don't know how to solve Question 1 by using group in Python. All I need to find is geo with it's latest time and
I don't know how to solve Question 1 by using group in Python. All I need to find is "geo" with it's latest "time" and "extreme_poverty_percent_people_below_125_a_day"
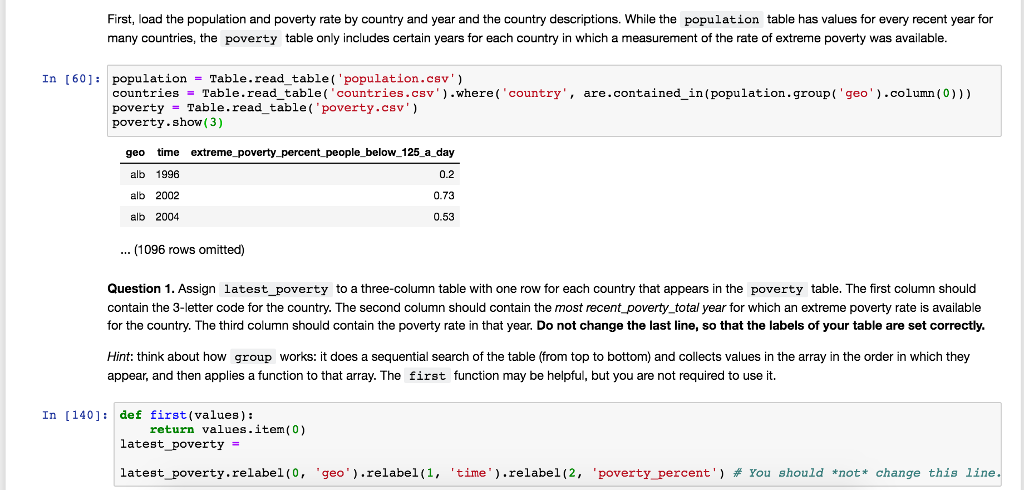
First, load the population and poverty rate by country and year and the country descriptions. While the population table has values for every recent year for many countries, the poverty table only includes certain years for each country in which a measurement of the rate of extreme poverty was available In [601 population - Table.read table ( 'population.csv') countries -Table.read table( countries.csv') .where(' country', are.contained in(population.group( 'geo).column(0))) poverty - Table.read table ( 'poverty.csv') poverty.show(3) geo time extreme poverty percent people_below 125_a_day 0.2 0.73 0.53 alb 1996 alb 2002 alb 2004 (1096 rows omitted) Question 1. Assign latest_poverty to a three-column table with one row for each country that appears in the poverty table. The first column should contain the 3-letter code for the country. The second column should contain the most recent poverty_total year for which an extreme poverty rate is available for the country. The third column should contain the poverty rate in that year. Do not change the last line, so that the labels of your table are set correctly. Hint: think about how group works: it does a sequential search of the table (from top to bottom) and collects values in the array in the order in which they appear, and then applies a function to that array. The first function may be helpful, but you are not required to use it. In [1401: def first (values): return values.item(0) latest _poverty - latest-poverty, relabel (0, 'geo').relabel (1, 'tine'), relabel (2, 'poverty-percent') # You should *not * change this line. First, load the population and poverty rate by country and year and the country descriptions. While the population table has values for every recent year for many countries, the poverty table only includes certain years for each country in which a measurement of the rate of extreme poverty was available In [601 population - Table.read table ( 'population.csv') countries -Table.read table( countries.csv') .where(' country', are.contained in(population.group( 'geo).column(0))) poverty - Table.read table ( 'poverty.csv') poverty.show(3) geo time extreme poverty percent people_below 125_a_day 0.2 0.73 0.53 alb 1996 alb 2002 alb 2004 (1096 rows omitted) Question 1. Assign latest_poverty to a three-column table with one row for each country that appears in the poverty table. The first column should contain the 3-letter code for the country. The second column should contain the most recent poverty_total year for which an extreme poverty rate is available for the country. The third column should contain the poverty rate in that year. Do not change the last line, so that the labels of your table are set correctly. Hint: think about how group works: it does a sequential search of the table (from top to bottom) and collects values in the array in the order in which they appear, and then applies a function to that array. The first function may be helpful, but you are not required to use it. In [1401: def first (values): return values.item(0) latest _poverty - latest-poverty, relabel (0, 'geo').relabel (1, 'tine'), relabel (2, 'poverty-percent') # You should *not * change this line
Step by Step Solution
There are 3 Steps involved in it

Get step-by-step solutions from verified subject matter experts