

Question: I don't understand how to approach this, Preview File Edit View Go Tools Window Help US Q 8 @ Wed Oct 19 6:29 PM .
I don't understand how to approach this,
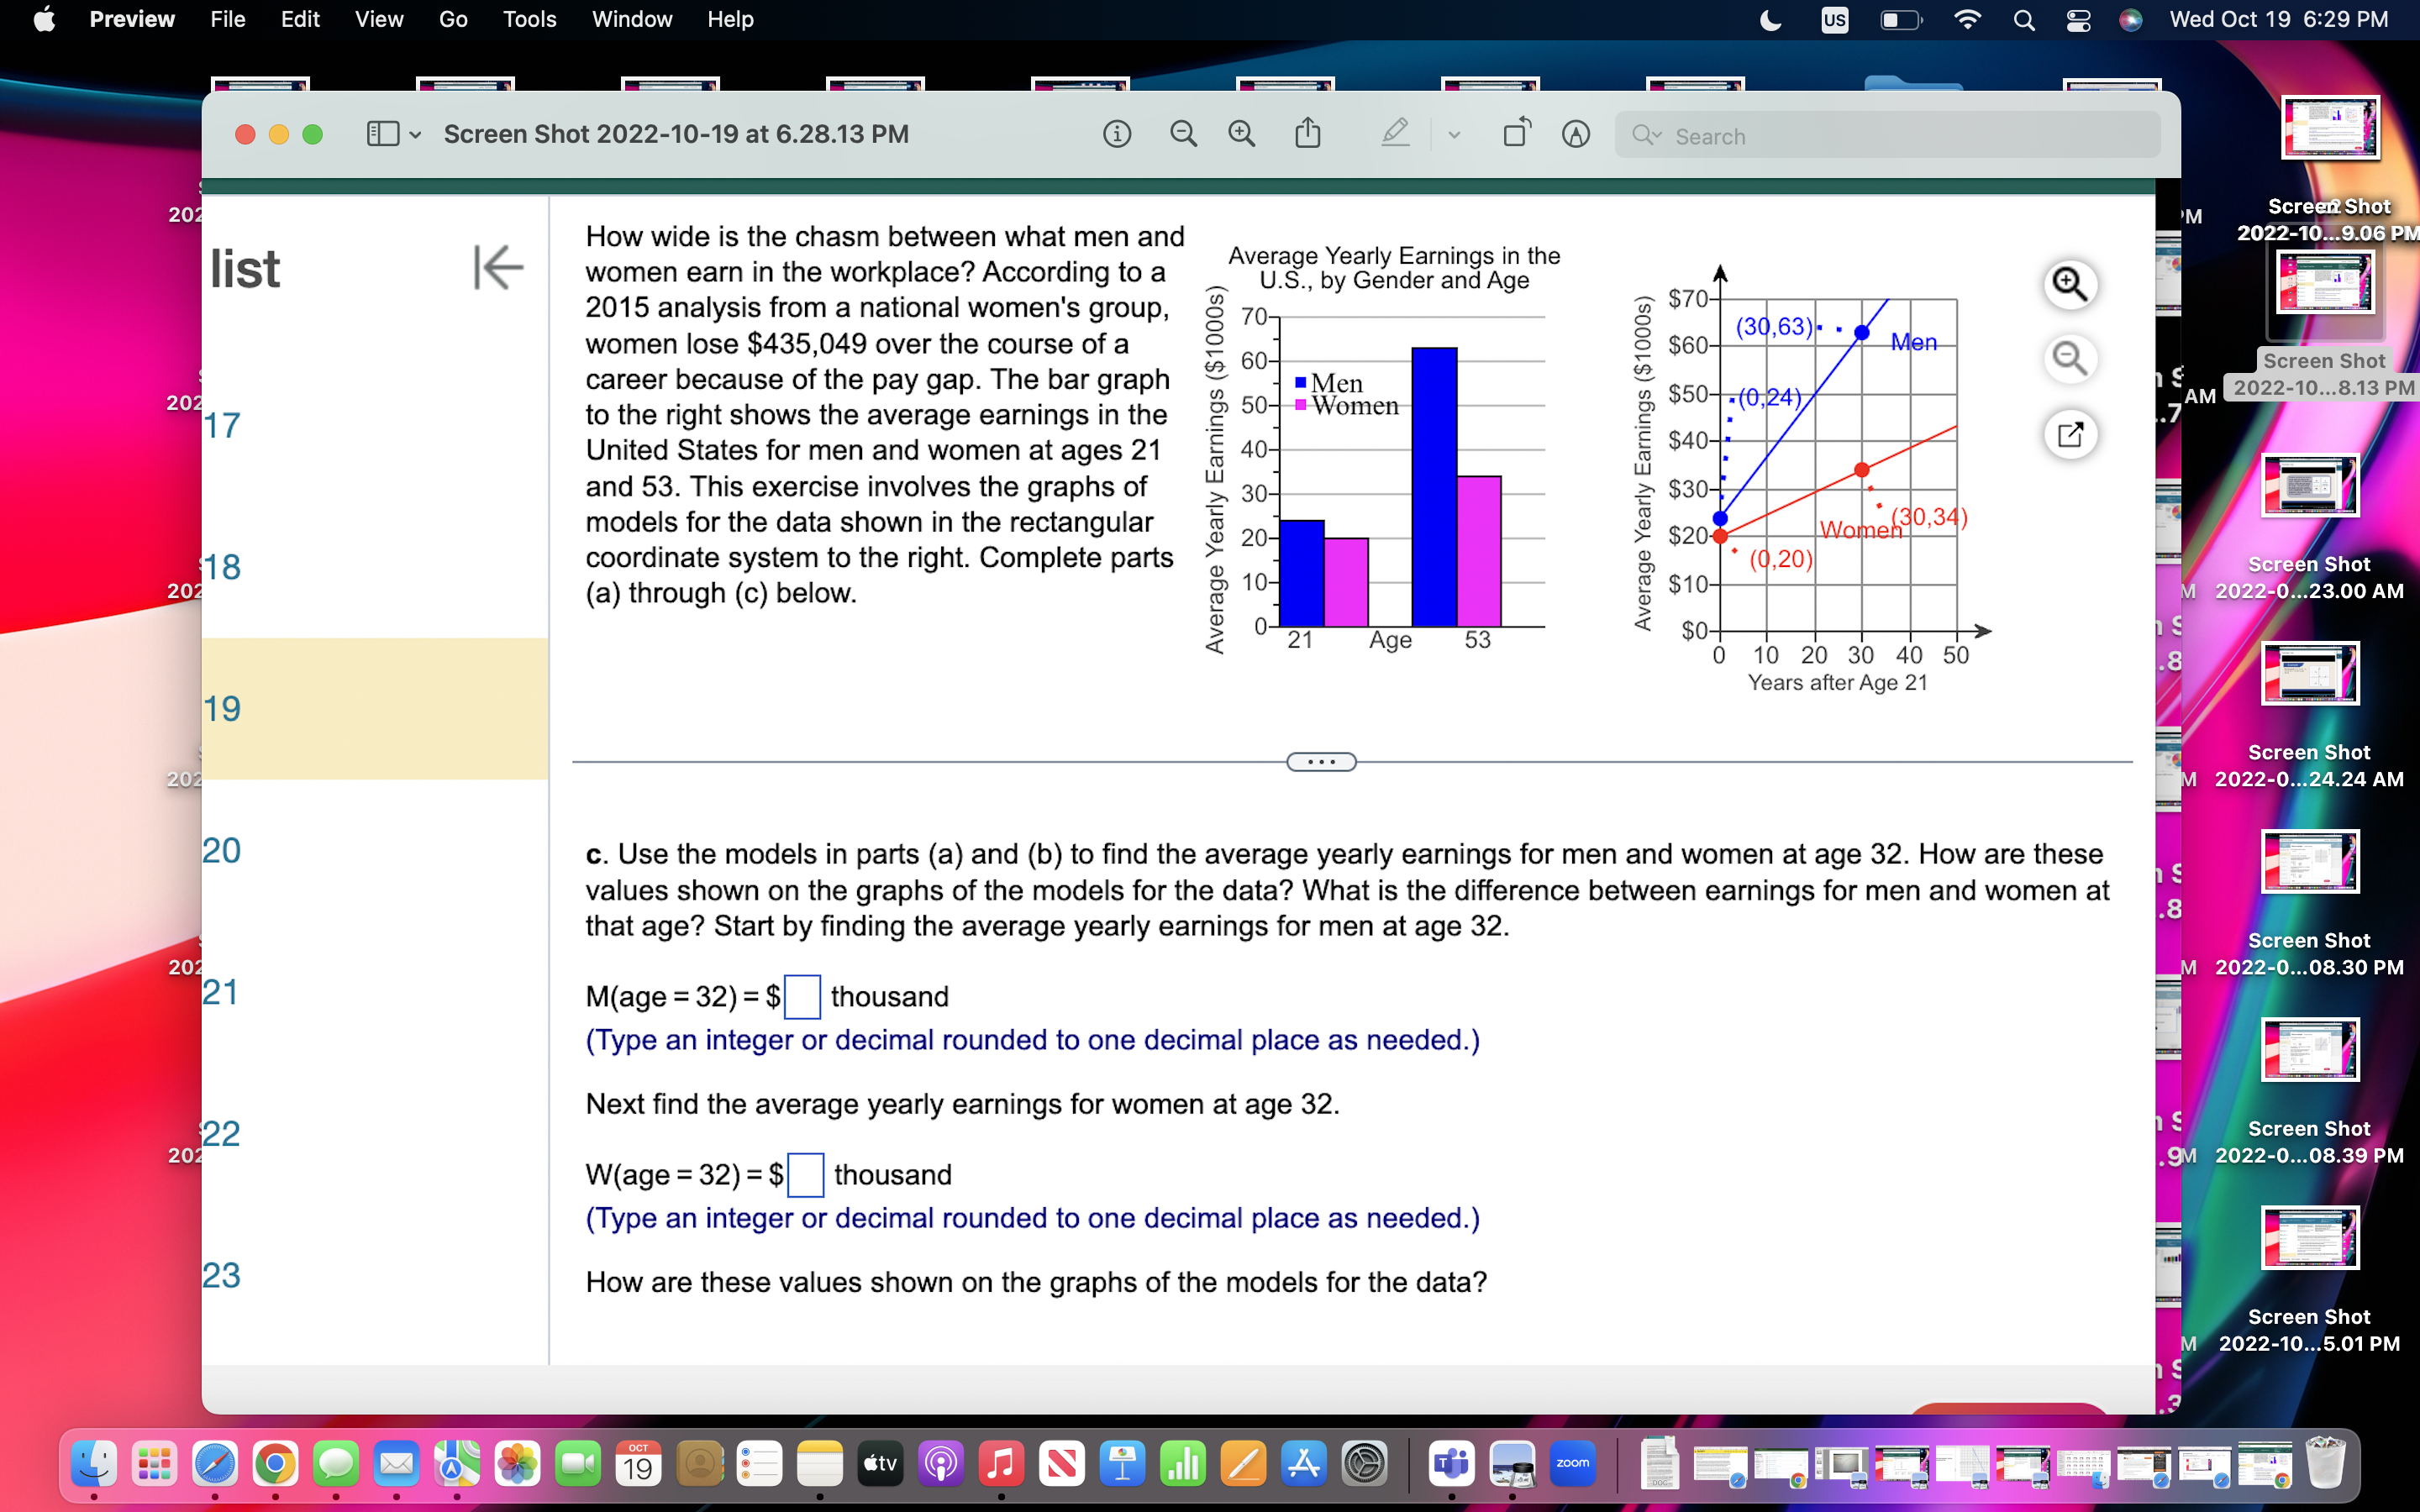
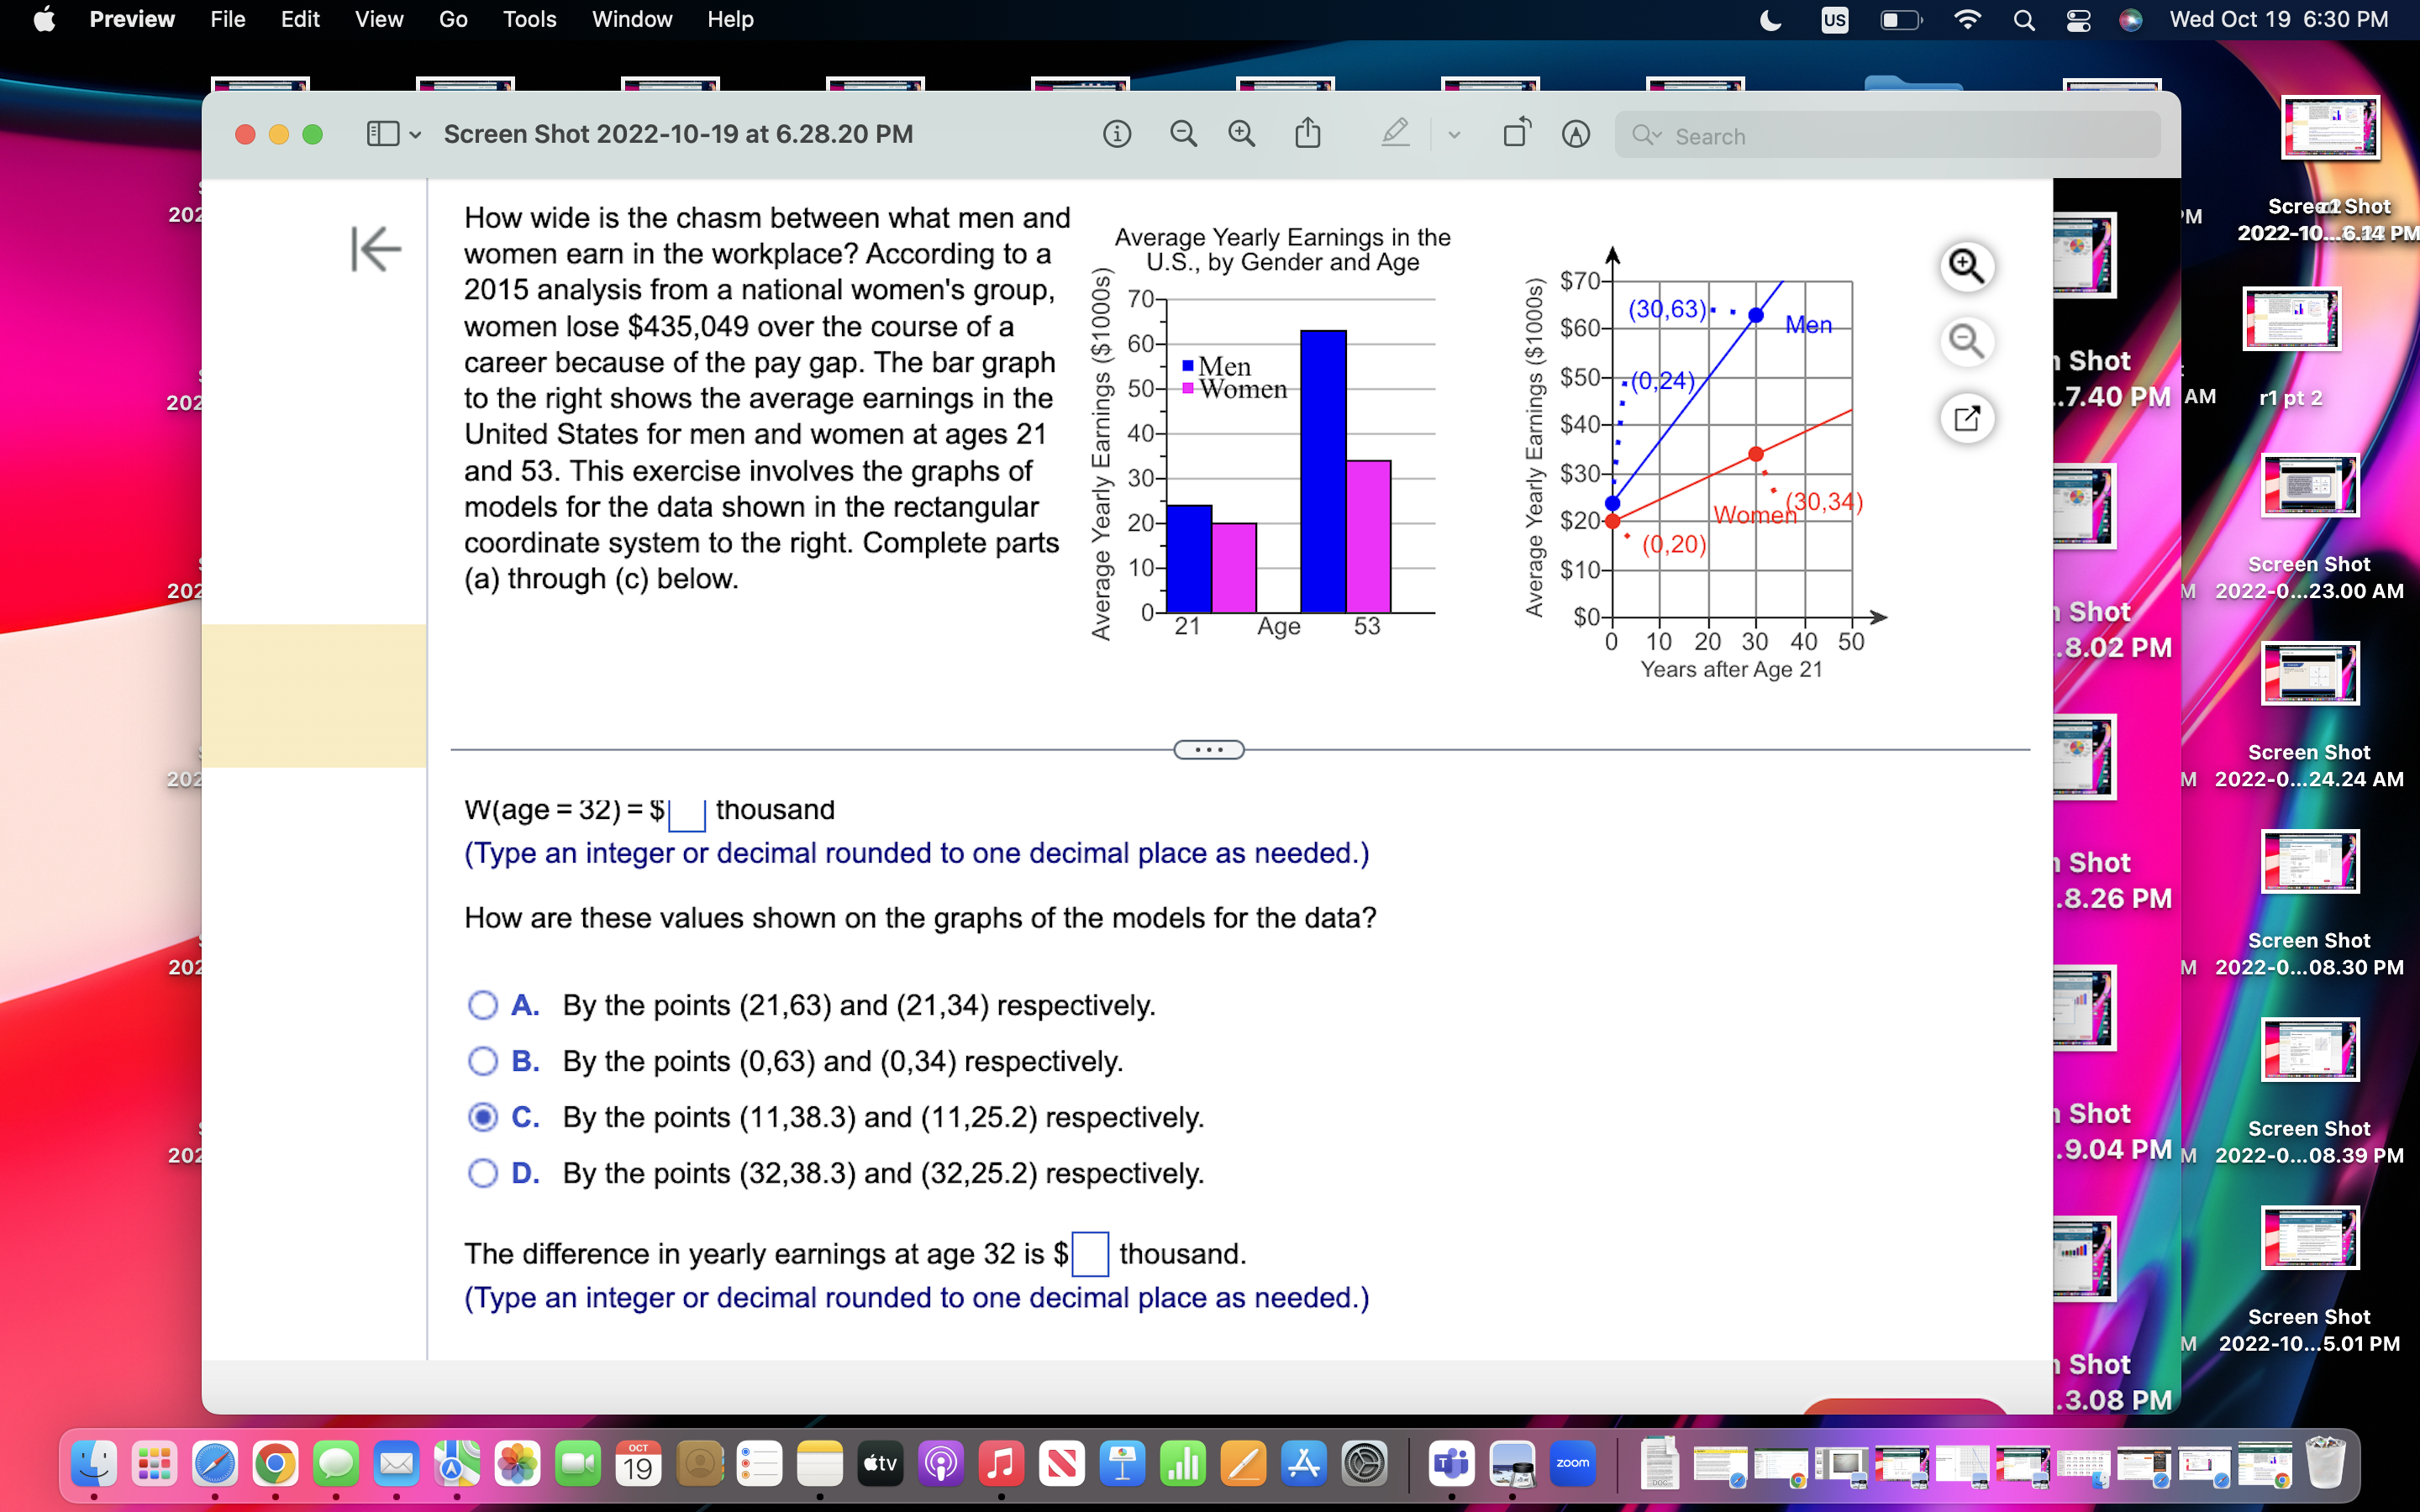
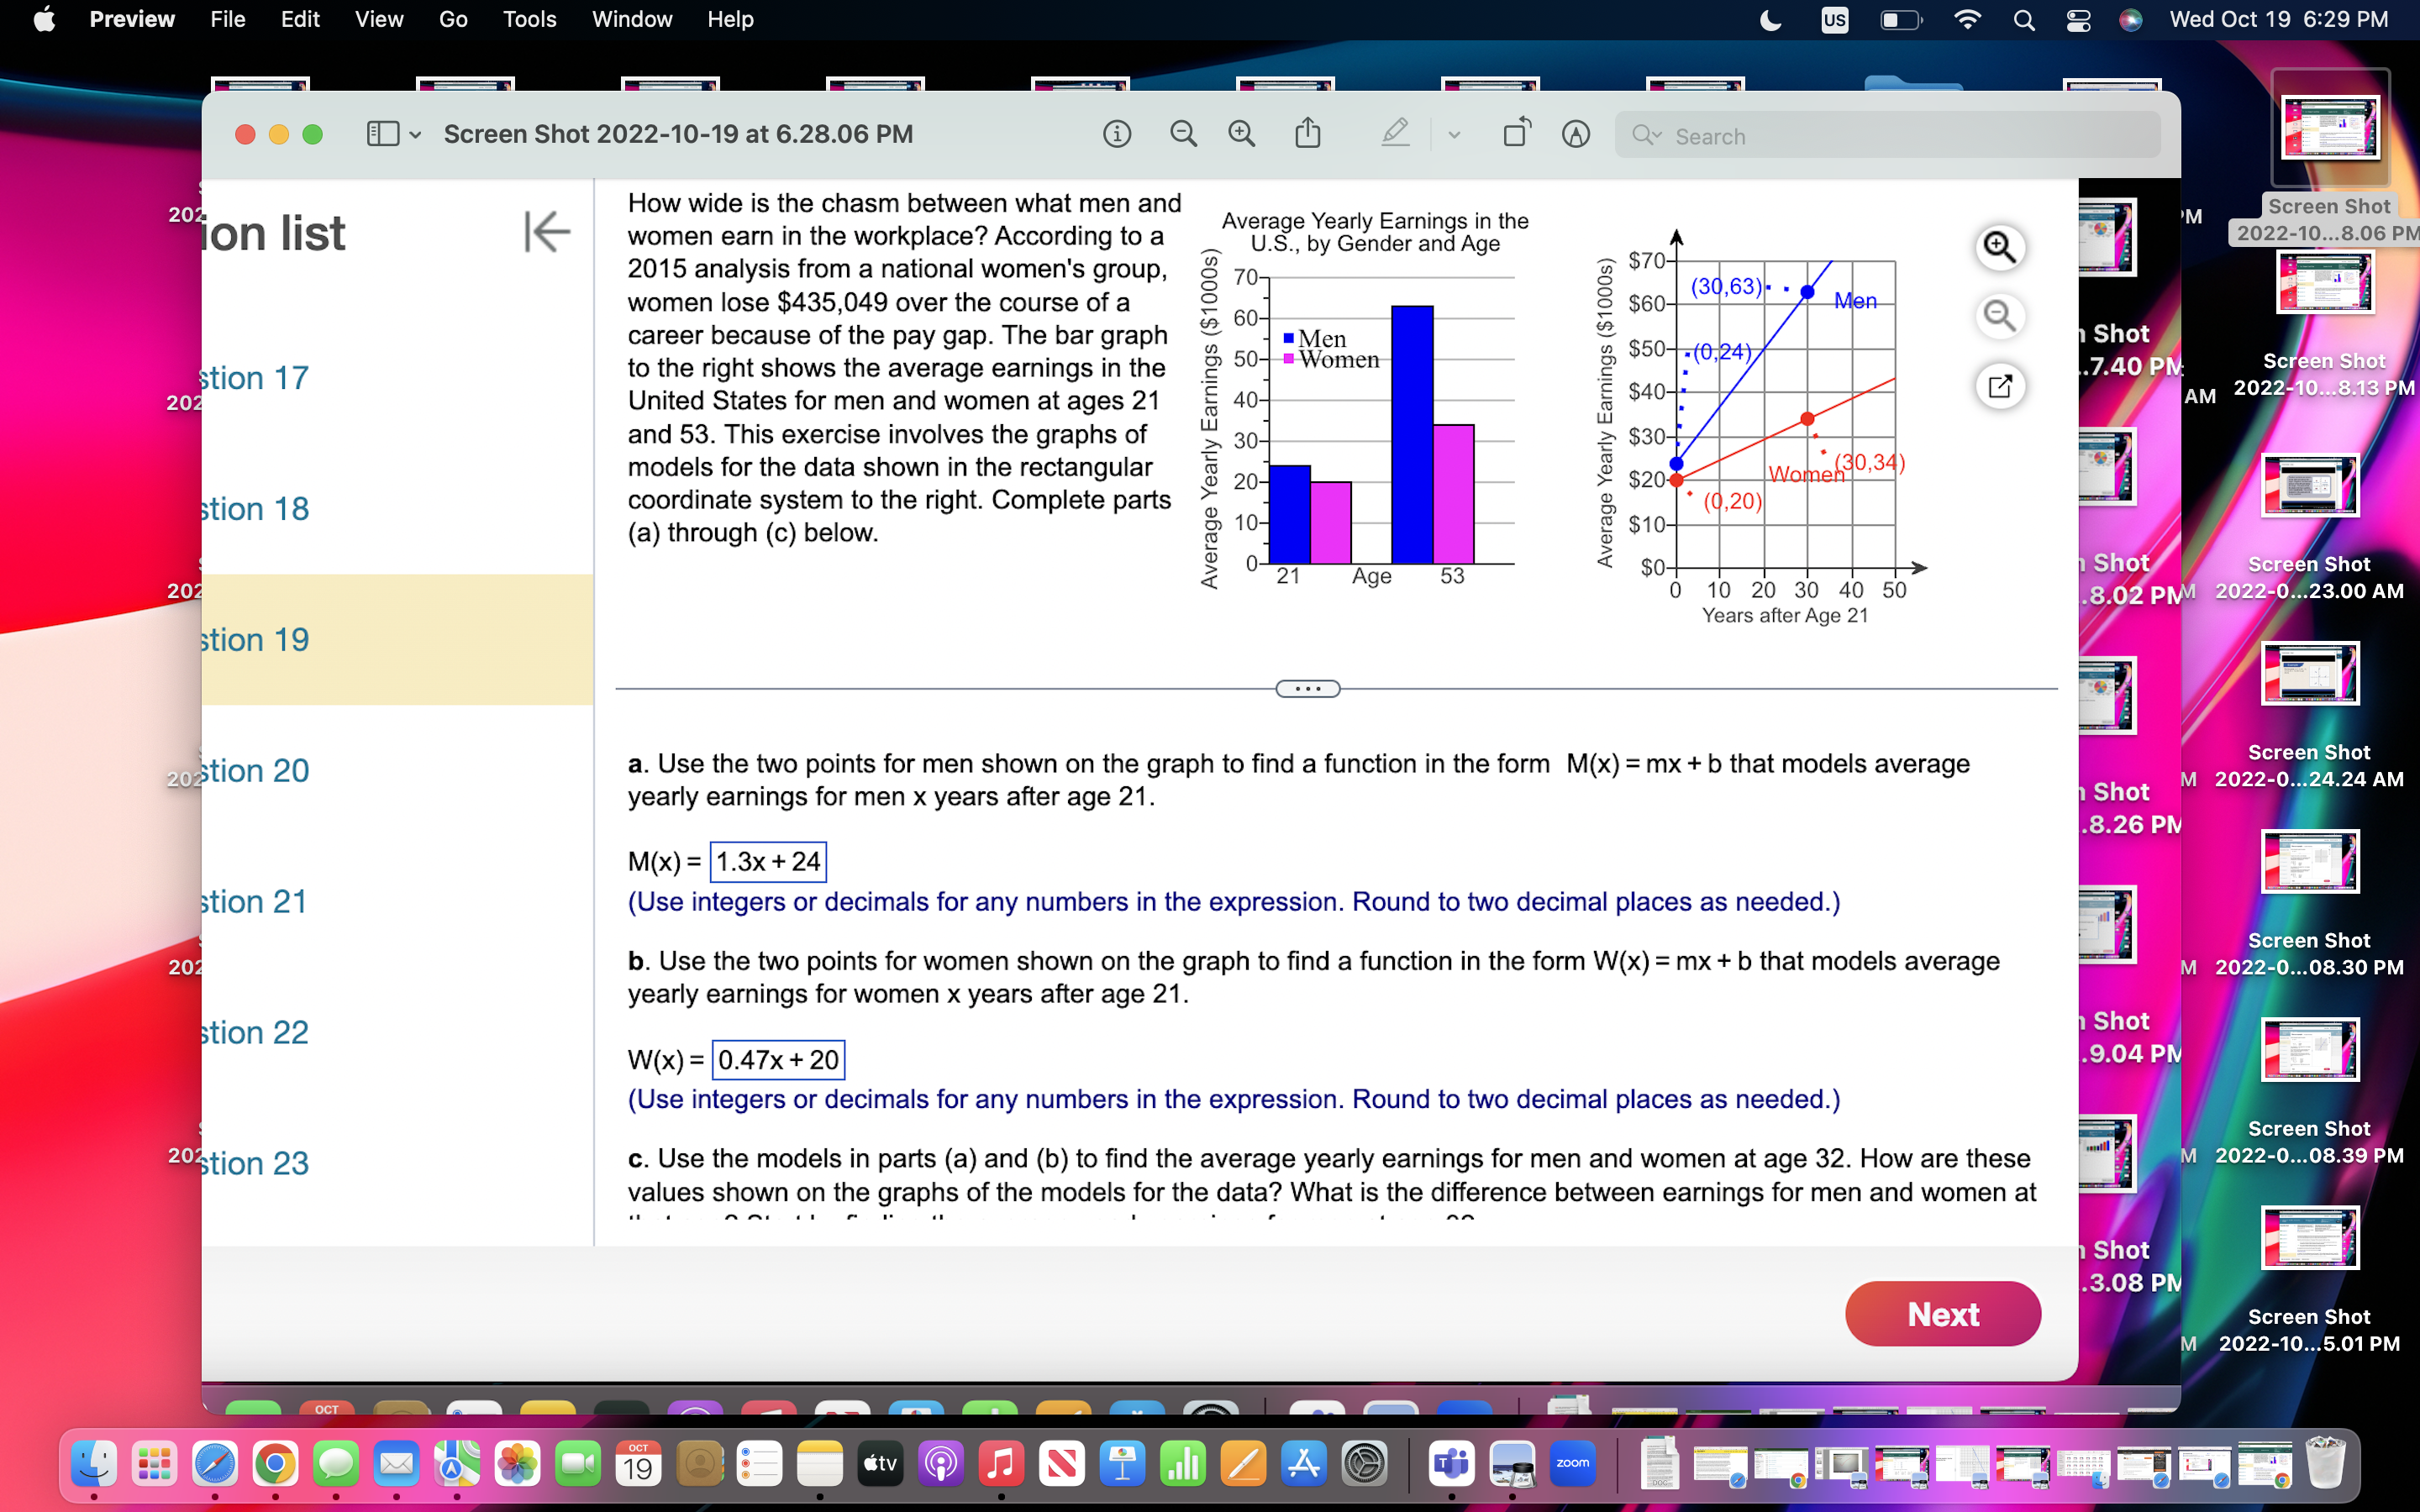
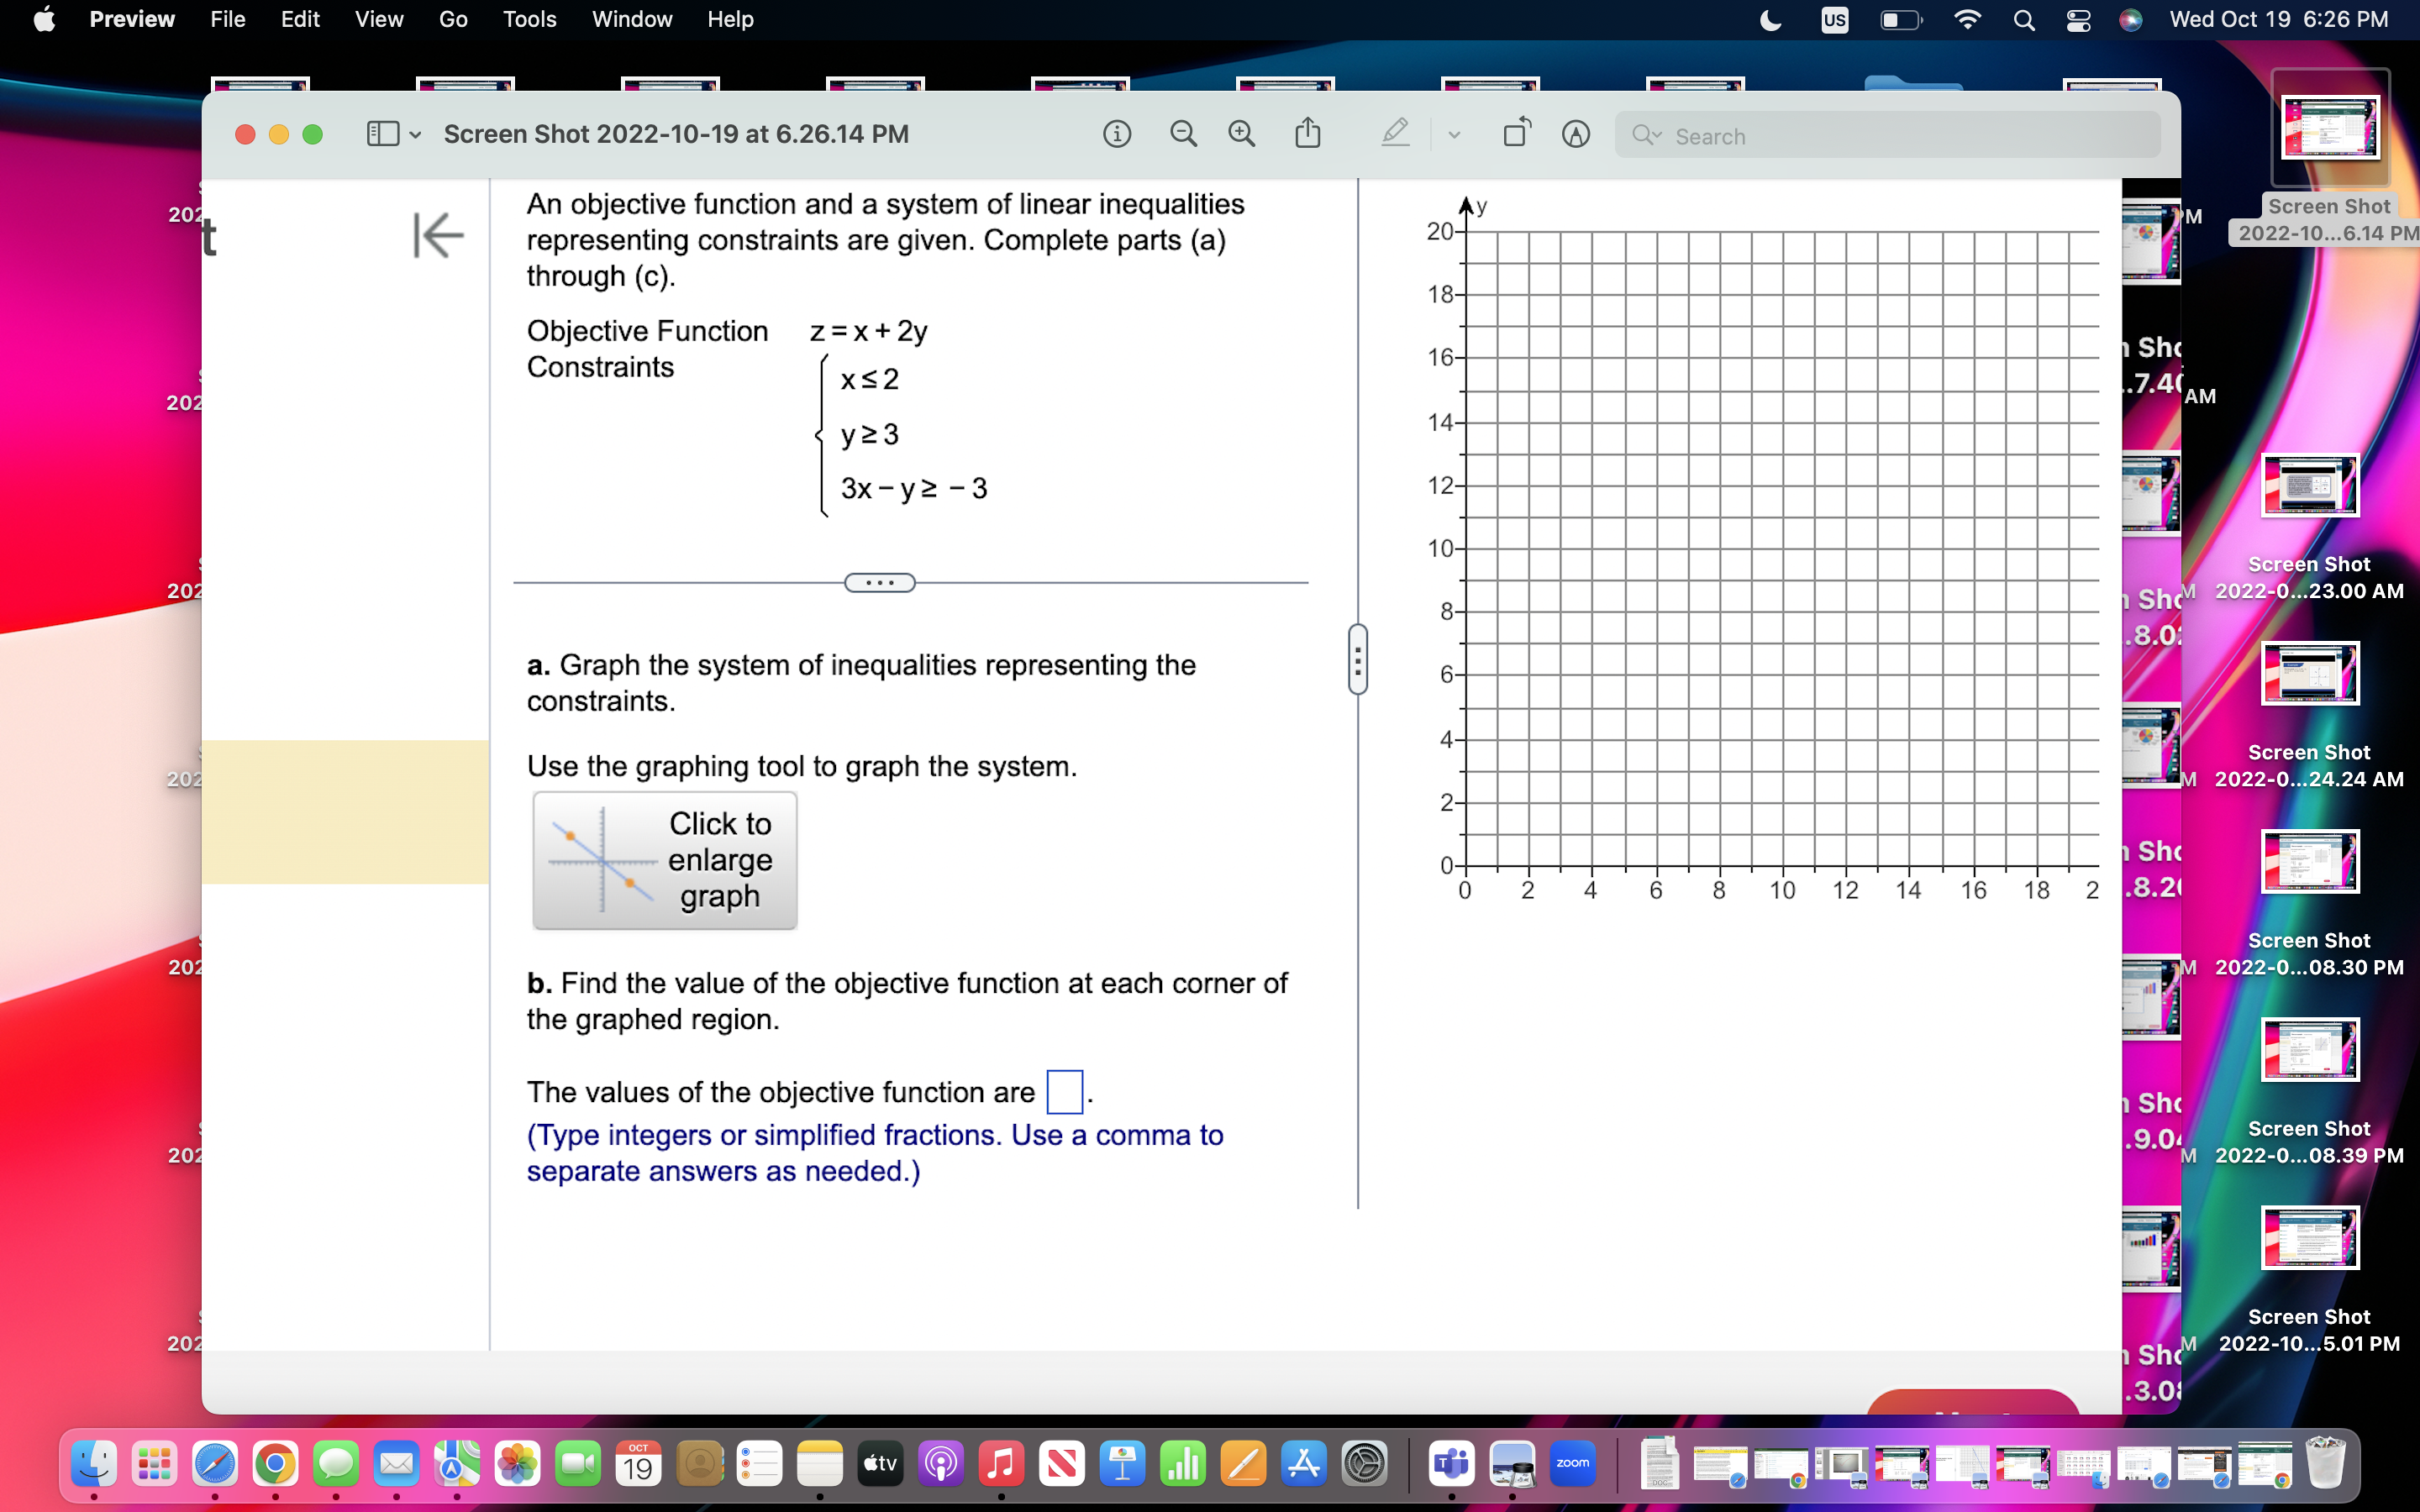
Preview File Edit View Go Tools Window Help US Q 8 @ Wed Oct 19 6:29 PM . .. Screen Shot 2022-10-19 at 6.28.13 PM Q Search 20 M Screen Shot How wide is the chasm between what men and 2022-10...9.06 P list K Average Yearly Earnings in the women earn in the workplace? According to a U.S., by Gender and Age 2015 analysis from a national women's group, $70 70- women lose $435,049 over the course of a 60- $60- (30,63). . Men Screen Shot career because of the pay gap. The bar graph Men 202 $50-. (0,24) AM 2022-10...8.13 PM 17 to the right shows the average earnings in the 50 - Women United States for men and women at ages 21 40- $40- Average Yearly Earnings ($1000s) Average Yearly Earnings ($1000s) and 53. This exercise involves the graphs of 30 - $30- models for the data shown in the rectangular (30, 34 ) 20- $20- 18 coordinate system to the right. Complete parts . (0,20) Screen Shot 202 (a) through (c) below. 10- $10 2022-0...23.00 AM 0 - $0+ in 21 Age 53 10 20 30 40 50 Years after Age 21 19 Screen Shot 202 2022-0...24.24 AM 20 c. Use the models in parts (a) and (b) to find the average yearly earnings for men and women at age 32. How are these values shown on the graphs of the models for the data? What is the difference between earnings for men and women at 8 that age? Start by finding the average yearly earnings for men at age 32. Screen Shot 202 2022-0...08.30 PM 21 M(age = 32) = $ thousand (Type an integer or decimal rounded to one decimal place as needed.) Next find the average yearly earnings for women at age 32. 22 S Screen Shot 202 W(age = 32) = $ thousand 9M 2022-0...08.39 PM (Type an integer or decimal rounded to one decimal place as needed.) 23 How are these values shown on the graphs of the models for the data? Screen Shot M 2022-10...5.01 PM O 19 stv 4Preview File Edit View Go Tools Window Help US Q 8 @ Wed Oct 19 6:30 PM ... Screen Shot 2022-10-19 at 6.28.20 PM Q Search 202 How wide is the chasm between what men and M Screat Shot K 2022-10...6.14 P women earn in the workplace? According to a Average Yearly Earnings in the U.S., by Gender and Age 2015 analysis from a national women's group, $70- 70- women lose $435,049 over the course of a $60- (30,63) . . Men 60- career because of the pay gap. The bar graph Men Shot $50- (0,24) 202 to the right shows the average earnings in the 50-Women .7.40 PM AM r1 pt 2 United States for men and women at ages 21 40- $40-- Average Yearly Earnings ($1000s) Average Yearly Earnings ($1000s and 53. This exercise involves the graphs of 30- $30- models for the data shown in the rectangular 20- $20 Wome ( 30, 34) coordinate system to the right. Complete parts (0,20) (a) through (c) below. 10- $10- Screen Shot 20 M 2022-0...23.00 AM 21 53 $0+ Shot Age 10 20 30 40 50 8.02 PM Years after Age 21 Screen Shot 202 M 2022-0...24.24 AM W(age = 32) = $| | thousand (Type an integer or decimal rounded to one decimal place as needed.) Shot 8.26 PM How are these values shown on the graphs of the models for the data? Screen Shot 202 M 2022-0...08.30 PM O A. By the points (21,63) and (21,34) respectively. O B. By the points (0,63) and (0,34) respectively. O C. By the points (11,38.3) and (11,25.2) respectively. Shot Screen Shot 202 9.04 PM M 2022-0...08.39 PM O D. By the points (32,38.3) and (32,25.2) respectively. The difference in yearly earnings at age 32 is $ thousand. (Type an integer or decimal rounded to one decimal place as needed.) Screen Shot M 2022-10...5.01 PM Shot 3.08 PM 19 stv A zoomPreview File Edit View Go Tools Window Help US Q 8 @ Wed Oct 19 6:29 PM ... Screen Shot 2022-10-19 at 6.28.06 PM Q Search 202 How wide is the chasm between what men and Screen Shot on list K women earn in the workplace? According to a Average Yearly Earnings in the M U.S., by Gender and Age 2022-10...8.06 P 2015 analysis from a national women's group, $70- 70- (30,63)- - women lose $435,049 over the course of a $60- Men 60- career because of the pay gap. The bar graph Men Shot $50-. (0,24) stion 17 to the right shows the average earnings in the 50- Women .7.40 PM Screen Shot 202 United States for men and women at ages 21 40- rage Yearly Earnings ($1000s) $40-- AM 2022-10...8.13 PM Average Yearly Earnings ($1000s) and 53. This exercise involves the graphs of 30- $30- models for the data shown in the rectangular 20- $20- Women30,34) stion 18 coordinate system to the right. Complete parts (9,20) (a) through (c) below. 10- $10- TO 21 Age 53 $0- Shot Screen Shot 20 0 10 20 30 40 50 8.02 PM 2022-0...23.00 AM Years after Age 21 stion 19 20tion 20 a. Use the two points for men shown on the graph to find a function in the form M(x) = mx + b that models average Screen Shot M 2022-0...24.24 AM yearly earnings for men x years after age 21. Shot 8.26 PM M(x) = 1.3x + 24 stion 21 (Use integers or decimals for any numbers in the expression. Round to two decimal places as needed.) Screen Shot 202 b. Use the two points for women shown on the graph to find a function in the form W(x) = mx + b that models average M 2022-0...08.30 PM yearly earnings for women x years after age 21. stion 22 Shot W(x) = 0.47x + 20 9.04 PM (Use integers or decimals for any numbers in the expression. Round to two decimal places as needed.) Screen Shot 20stion 23 c. Use the models in parts (a) and (b) to find the average yearly earnings for men and women at age 32. How are these M 2022-0...08.39 PM values shown on the graphs of the models for the data? What is the difference between earnings for men and women at Shot .3.08 PM Next Screen Shot M 2022-10...5.01 PM 19 stv 4 zoomPreview File Edit View Go Tools Window Help US Q Wed Oct 19 6:26 PM ... Screen Shot 2022-10-19 at 6.26.07 PM Qu Search 20 Screen Shot A theater is presenting a program on drinking and driving for students and their parents or other responsible adults. The 2022-10...6.14 P K proceeds will be donated to a local alcohol information center. Admission is $16.00 for adults and $8.00 for students. However, this situation has two constraints: The theater can hold no more than 240 people and for every two adults, there must be at least one student. How many adults and students should attend to raise the maximum amount of money? Shot S 202 .7.40 PM 2022AM To raise the maximum amount of money, 160 adults and 80 students should attend. Screen Shot 20 Shot S 2022-0...23.00 AM 8.02 PM 2022 Screen Shot 202 M 2022-0...24.24 AM Shot S 8.26 PM 2022 Screen Shot 202 M 2022-0...08.30 PM Shot 9.04 PM 2022 Screen Shot 202 M 2022-0...08.39 PM X Vi More Shot S Screen Shot 202 3.08 PM 202M 2022-10...5.01 PM Next 19 tv T Call 4 ZOOM 10Preview File Edit View Go Tools Window Help US Q 8 @ Wed Oct 19 6:26 PM ... Screen Shot 2022-10-19 at 6.26.14 PM Q Search 204 K An objective function and a system of linear inequalities 20- M Screen Shot representing constraints are given. Complete parts (a) 2022-10...6.14 P through (c). 18 Objective Function z=x+ 2y Sho Constraints 16 XS2 202 .7.4AM 14. y23 3x - yz - 3 12 10. Screen Shot 20 8- Sha 2022-0...23.00 AM 8.0 a. Graph the system of inequalities representing the 6 - constraints. 4- Screen Shot 202 Use the graphing tool to graph the system. 2022-0...24.24 AM 2- Click to enlarge Sho graph 8 10 12 14 16 18 2 .8.2 Screen Shot 202 b. Find the value of the objective function at each corner of 2022-0...08.30 PM the graphed region. The values of the objective function are. Sho (Type integers or simplified fractions. Use a comma to 9.04 Screen Shot 202 M 2022-0...08.39 PM separate answers as needed.) Screen Shot 202 Sh 2022-10...5.01 PM 3.0 19 zoom
Step by Step Solution
There are 3 Steps involved in it

Get step-by-step solutions from verified subject matter experts