

Question: I dont understand how to do this using the function in excel. I added the information below but i also just dont know where to
I dont understand how to do this using the function in excel. I added the information below but i also just dont know where to start with this problem or what formulas to .
Simulation numbers:
6000 -28000 29000 -19000 -33000 -8000 -8000 6000 -14000 -8000 -42000 1000 -28000 6000 14000 -22000 -14000 6000 34000 -8000 14000 -28000 -3000 14000 6000 -22000 11000 -8000 14000 -14000 -3000 6000 29000 -22000 -9000 29000 1000 -13000 11000 -42000 -8000 -27000 -23000 -3000 -8000 -27000 -42000 -13000 6000 19000
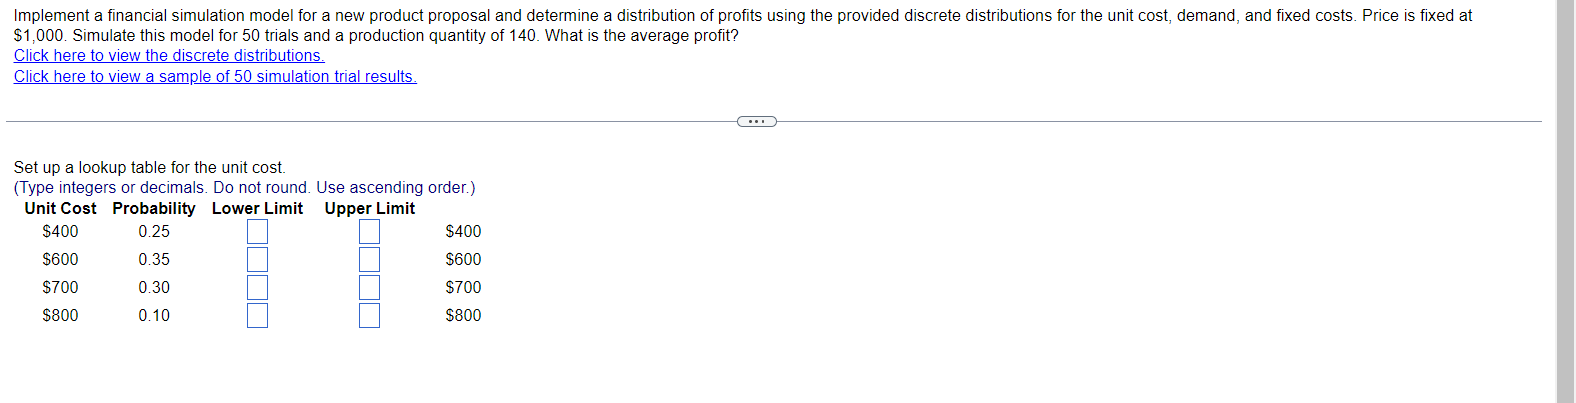
implement a nanual Simulation model for a new product proposal and determine a distribution of prots using the provided discrete distributions for the unit cost' demand, and fixed costs. Price is fixed at 91:000. Simulate this model for 50 trials and a production quantity of 140. What is the average prot'? Click here to VIEW the discrete distributions Click hereto View a sample of 50 Simulation trial results, Setup a lookup table for the unit Cost. (Type integers or deCimals Do not round Use ascending order) Unit Cost Probability Lower Limit Upper Limit $400 0 25 5400 $600 0 35 5600 $700 0 30 9700 $800 0 10 3800
Step by Step Solution
There are 3 Steps involved in it

Get step-by-step solutions from verified subject matter experts