

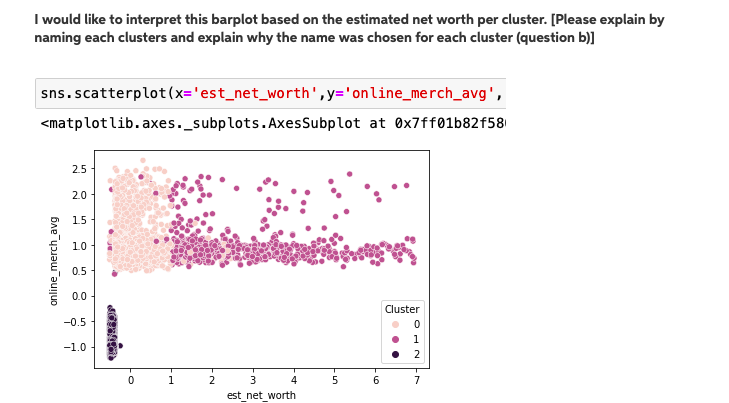
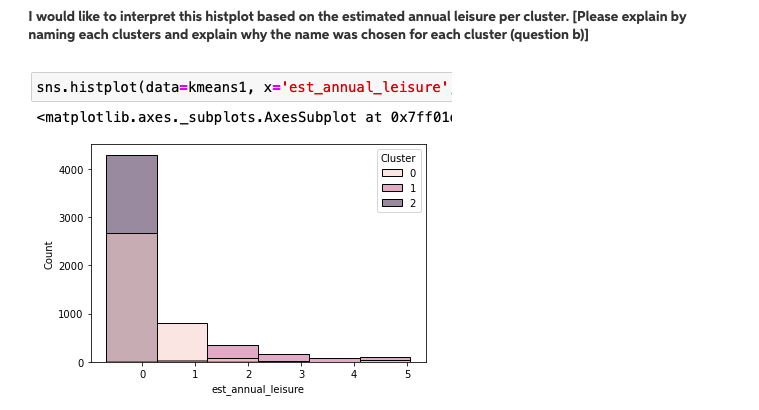
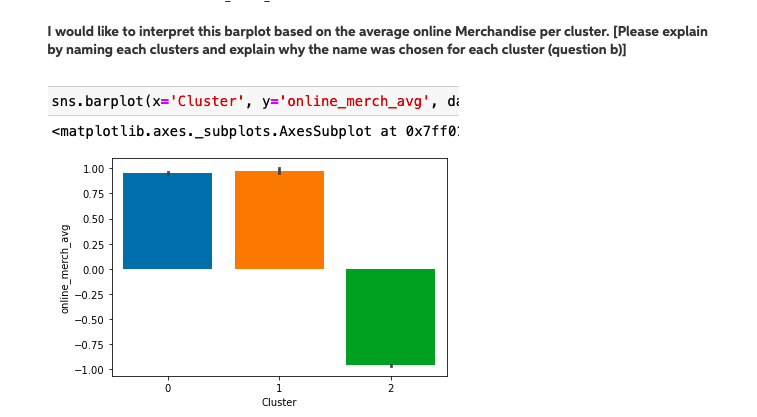
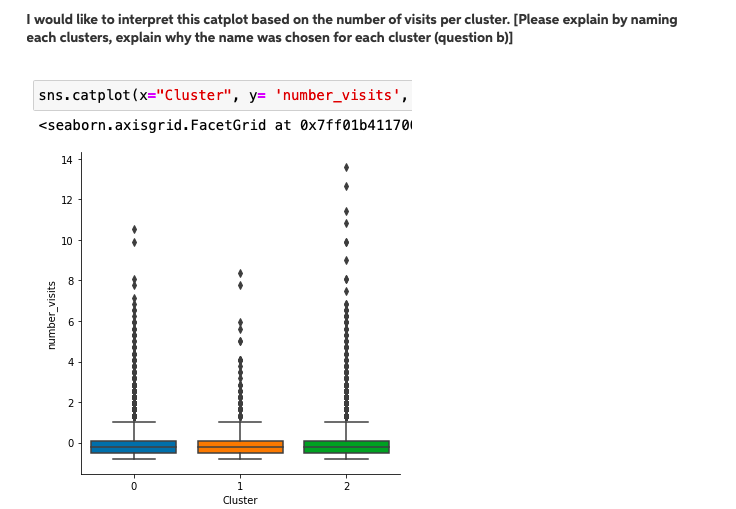
Question: I don't understand. Please explain a. Please describe each visualization and what it says about the model ? b. For each cluster cluster 0, cluster

I don't understand. Please explain
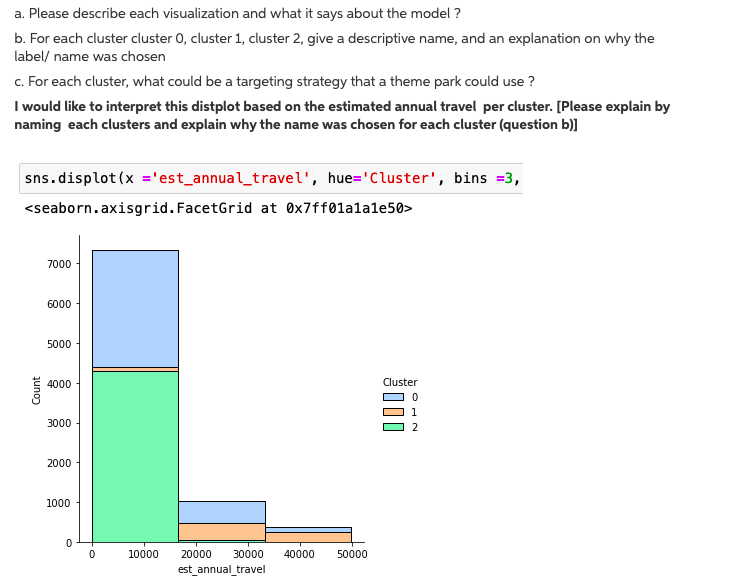

![the name was chosen for each cluster (question b)] sns . displot](https://s3.amazonaws.com/si.experts.images/answers/2024/06/667b329dcc285_917667b329db90ad.jpg)
a. Please describe each visualization and what it says about the model ? b. For each cluster cluster 0, cluster 1, cluster 2, give a descriptive name, and an explanation on why the label/ name was chosen c. For each cluster, what could be a targeting strategy that a theme park could use ? I would like to interpret this distplot based on the estimated annual travel per cluster. [Please explain by naming each clusters and explain why the name was chosen for each cluster (question b)] sns . displot (x ='est_annual_travel', hue='Cluster', bins =3,
Step by Step Solution
There are 3 Steps involved in it

Get step-by-step solutions from verified subject matter experts