

Question: i dont understand this chart Home Insert Draw Page Layout Formulas Data Review View | Tell me X Cut Calibri (Body) 11 ab Wrap Text
i dont understand this chart
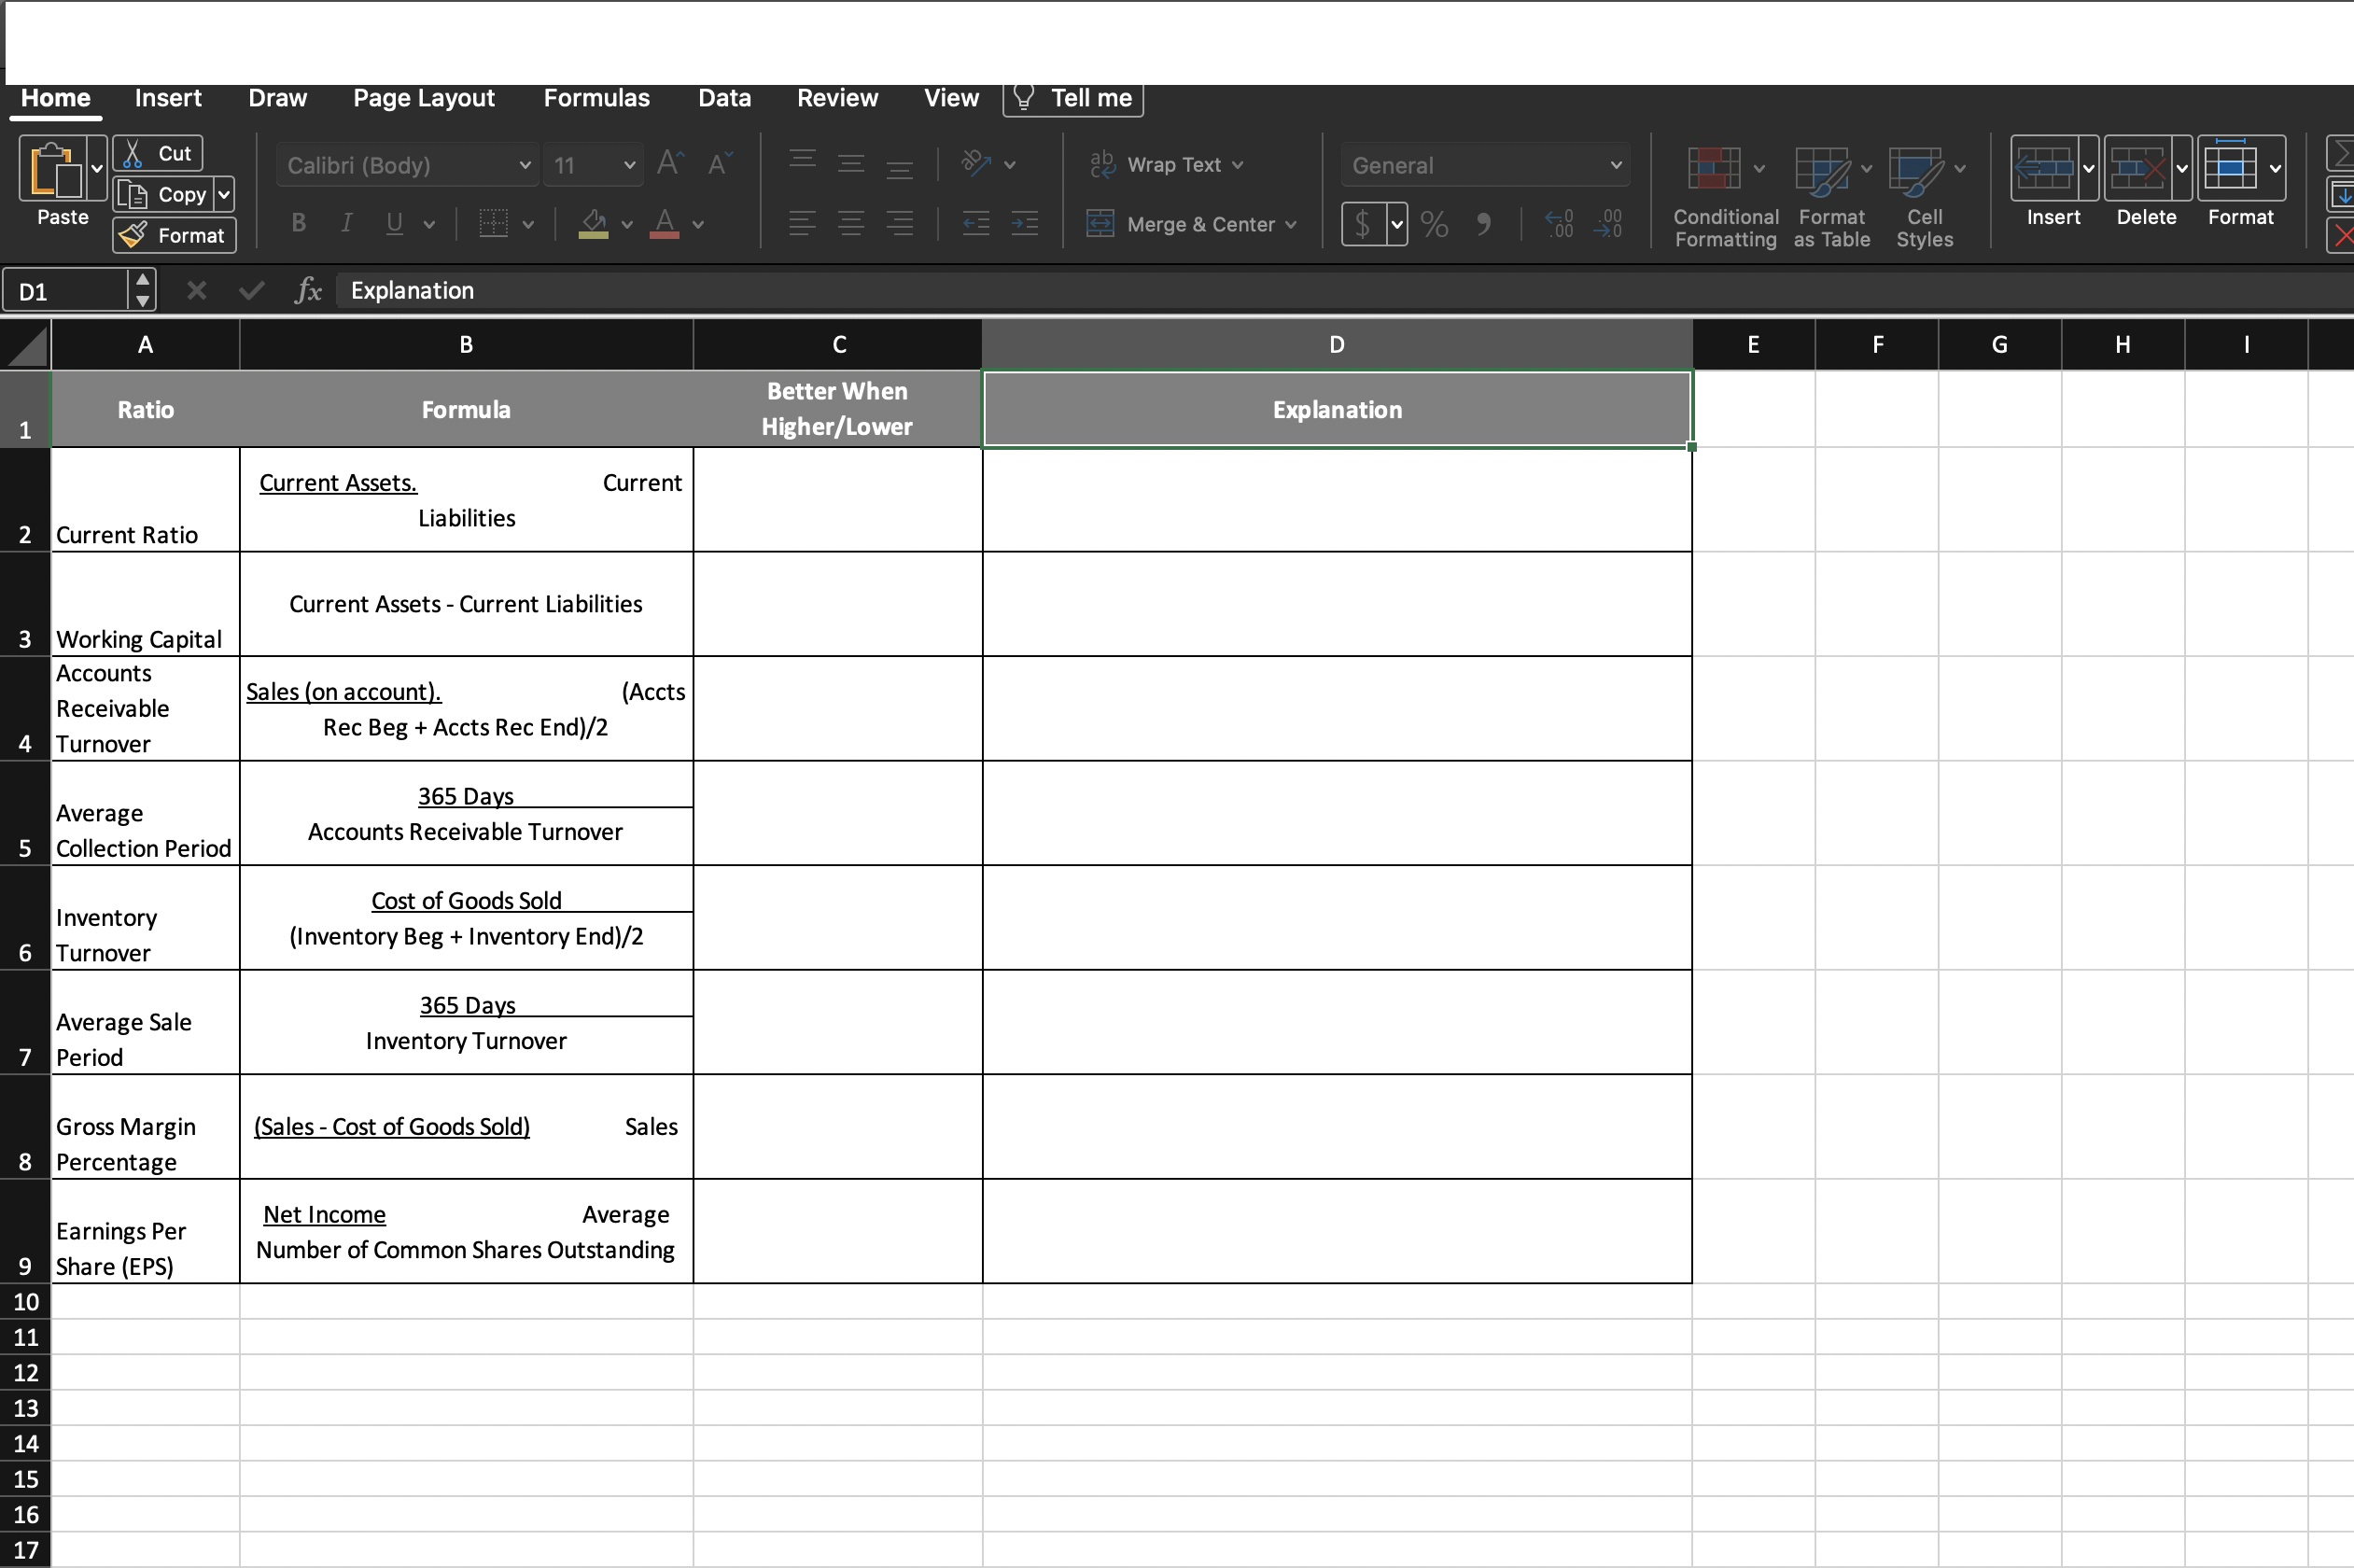
Home Insert Draw Page Layout Formulas Data Review View | Tell me X Cut Calibri (Body) 11 ab Wrap Text v General G Copy Paste Format B U v Merge & Center v $ % 19 00 Conditional Format Cell Insert Delete Format Formatting as Table Styles D1 X V fx Explanation A B C D E F G H I Formula Better When Ratio Higher/Lower Explanation Current Assets. Current Current Ratio Liabilities Current Assets - Current Liabilities Working Capital Accounts Receivable Sales (on account). (Accts Turnover Rec Beg + Accts Rec End)/2 Average 365 Days 5 Collection Period Accounts Receivable Turnover Inventory Cost of Goods Sold Turnover (Inventory Beg + Inventory End)/2 Average Sale 365 Days Period Inventory Turnover Gross Margin (Sales - Cost of Goods Sold) Sales 8 Percentage Earnings Per Net Income Average 9 Share (EPS) Number of Common Shares Outstanding 10 11 12 13 14 15 16 17
Step by Step Solution
There are 3 Steps involved in it

Get step-by-step solutions from verified subject matter experts