

Question: i dont understand this process The table shows (lifetime) peptic ulcer rates (per 100 population) for various family incomes as reported by the National Health
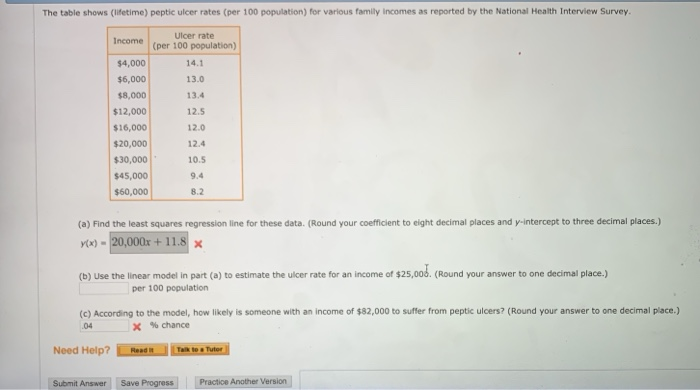
The table shows (lifetime) peptic ulcer rates (per 100 population) for various family incomes as reported by the National Health Interview Survey. Ulcer rate Income (per 100 population) $4,000 $6,000 8,000 $12,000 $16,000 14.1 13.0 13.4 12.5 12.0 $20,000 12.4 $30,000 10.5 $45,000 9.4 $60,000 8.2 (a) Find the least squares regression line for these data. (Round your coeficient to eight decimal places and y-intercept to three decimal places.) y(x) 20,000x +11.8 x (b) Use the linear model in part (o) to estimate the ulcer rate for an income of $25,o0d. (Round your answer to one decimal place.) (c) According to the model, how likely is someone with an income of $82,000 to suffer from peptic ulcers? (Round your answer to one decimal pilace.) per 100 population 04 % chance Submit Answer Save Progress Practice Another Version
Step by Step Solution
There are 3 Steps involved in it

Get step-by-step solutions from verified subject matter experts