

Question: i don't understand this Table 1. The data in Table 1 represent a set of Anxiety Scores reported by a sample of adult male respondents
i don't understand this
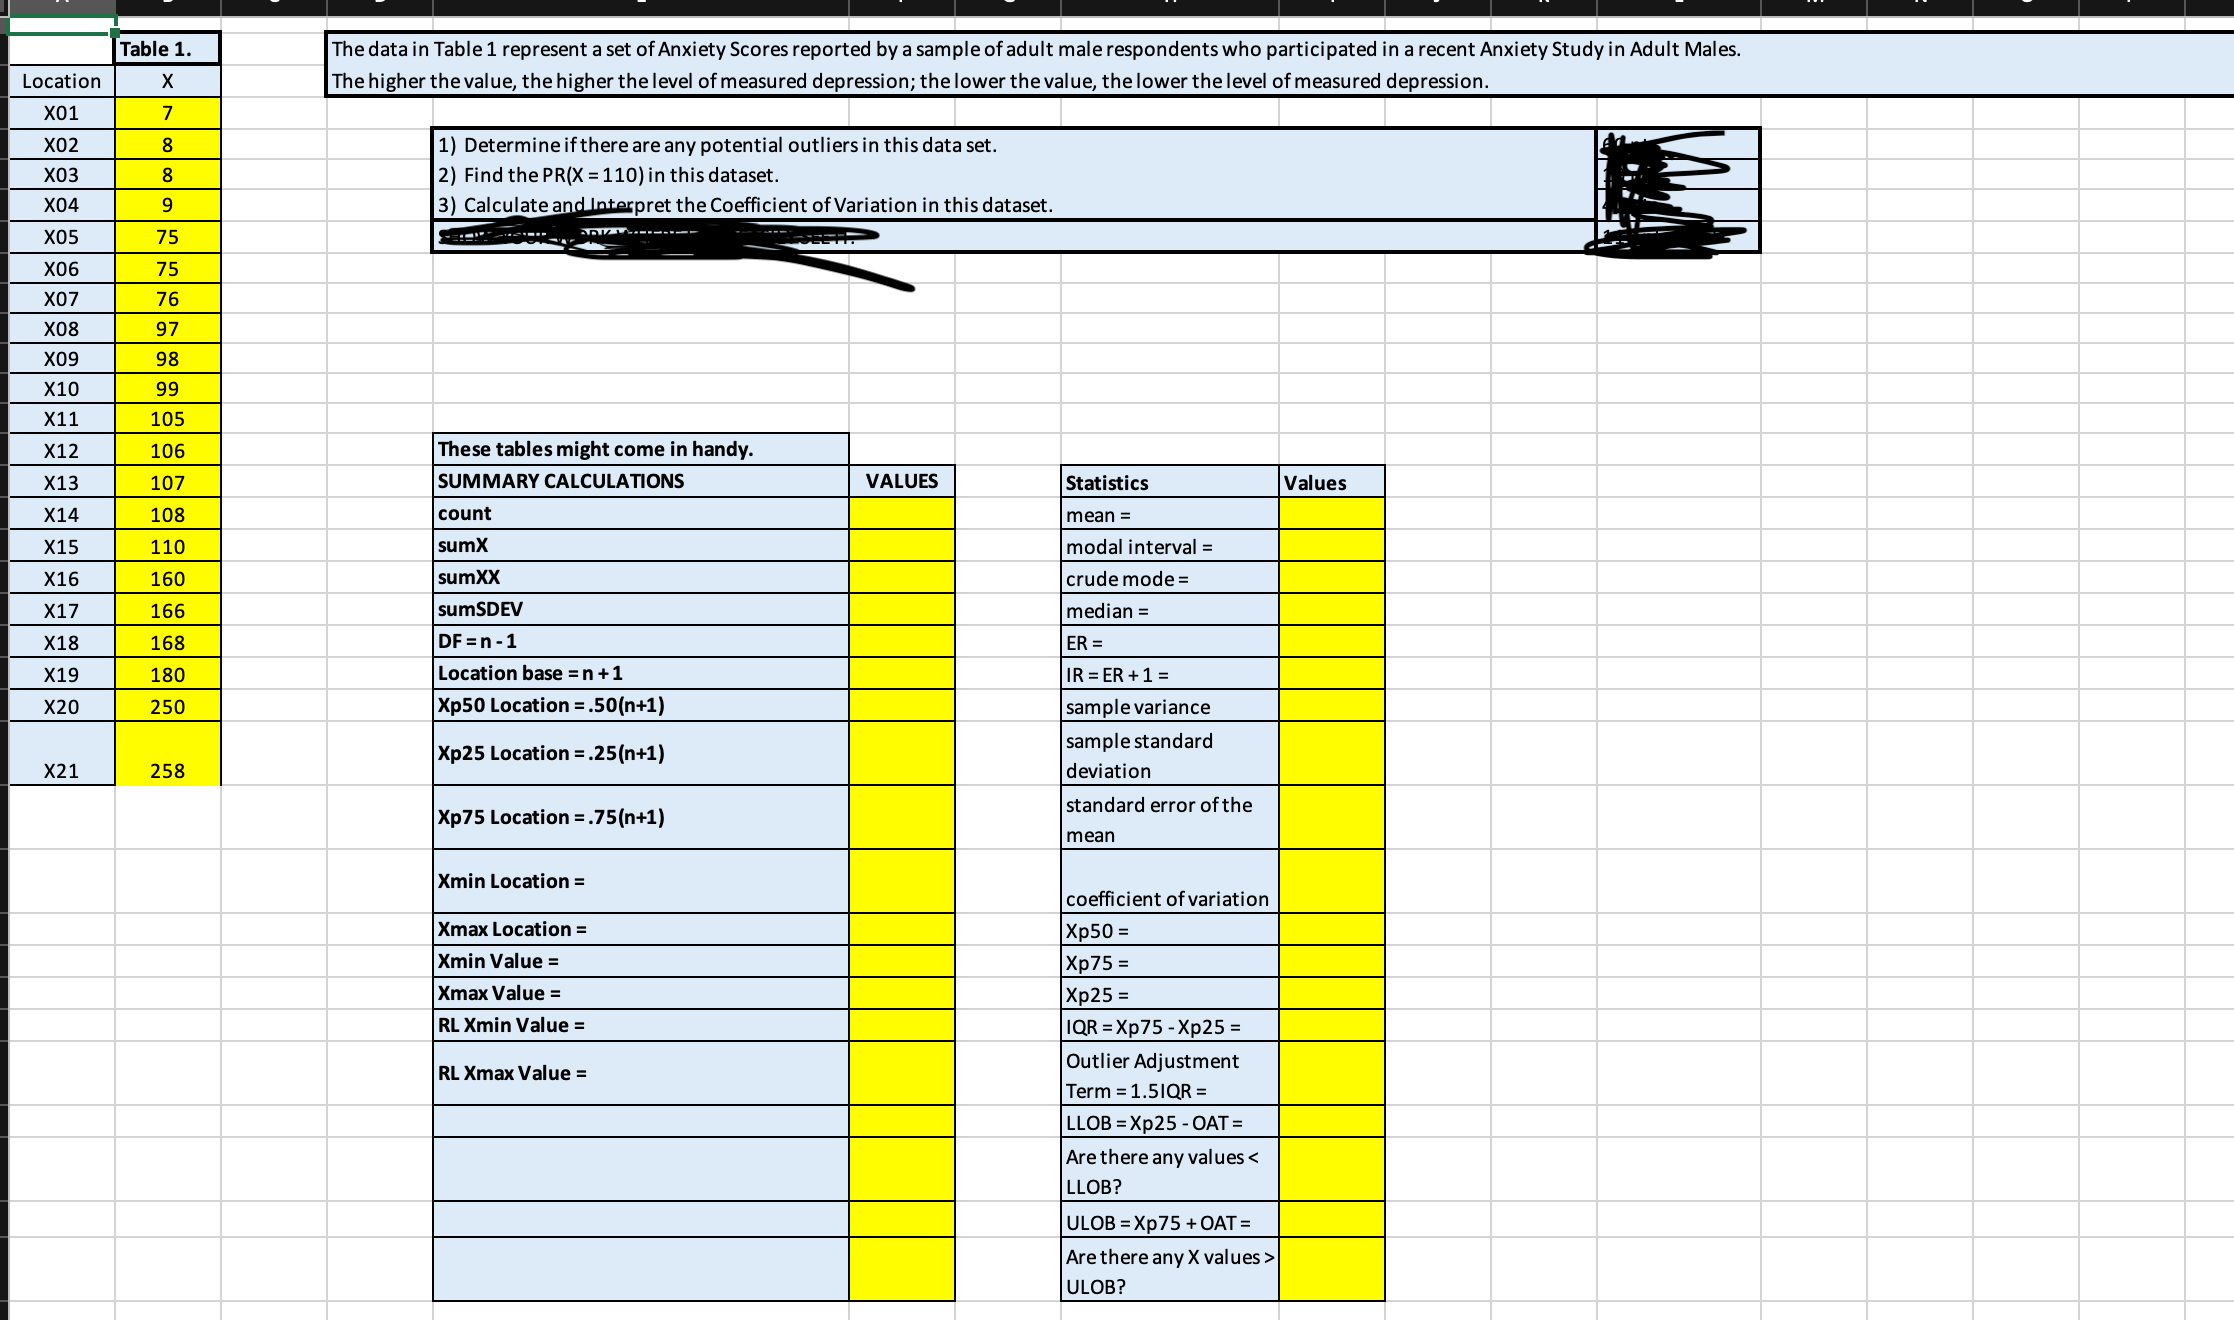
Table 1. The data in Table 1 represent a set of Anxiety Scores reported by a sample of adult male respondents who participated in a recent Anxiety Study in Adult Males. Location X The higher the value, the higher the level of measured depression; the lower the value, the lower the level of measured depression. X0 1 7 X02 8 1) Determine if there are any potential outliers in this data set. X03 8 2) Find the PR(X = 110) in this dataset. X04 9 3) Calculate and Interpret the Coefficient of Variation in this dataset. X05 75 X06 75 X07 76 X08 97 XOS 98 X10 99 X11 105 K12 106 These tables might come in handy X13 107 SUMMARY CALCULATIONS VALUES Statistics Values X14 108 count mean = X15 110 sumX modal interval = X16 160 sumXX crude mode: X17 166 sumSDEV median = X18 168 DF =n- 1 ER = X19 180 Location base = n + 1 IR = ER + 1 = X20 250 Xp50 Location = .50(n+1) sample variance Xp25 Location =.25(n+1) sample standard X21 258 deviation Xp75 Location =.75(n+1) standard error of the mean Xmin Location = coefficient of variation Xmax Location = Xp50 = Xmin Value = Xp75 = Xmax Value = Xp25 = RL Xmin Value = IQR = XP75 - Xp25 = RL Xmax Value = Outlier Adjustment Term = 1.51QR = LLOB = Xp25 - OAT = Are there any values ULOB
Step by Step Solution
There are 3 Steps involved in it

Get step-by-step solutions from verified subject matter experts