

Question: I don't understand why the values on the t - axis are like this when I draw a graph of Z ( t ) .
I don't understand why the values on the taxis are like this when I draw a graph of Zt I will attach the graph of Yt Please explain why the taxis, wowmwc is placed!
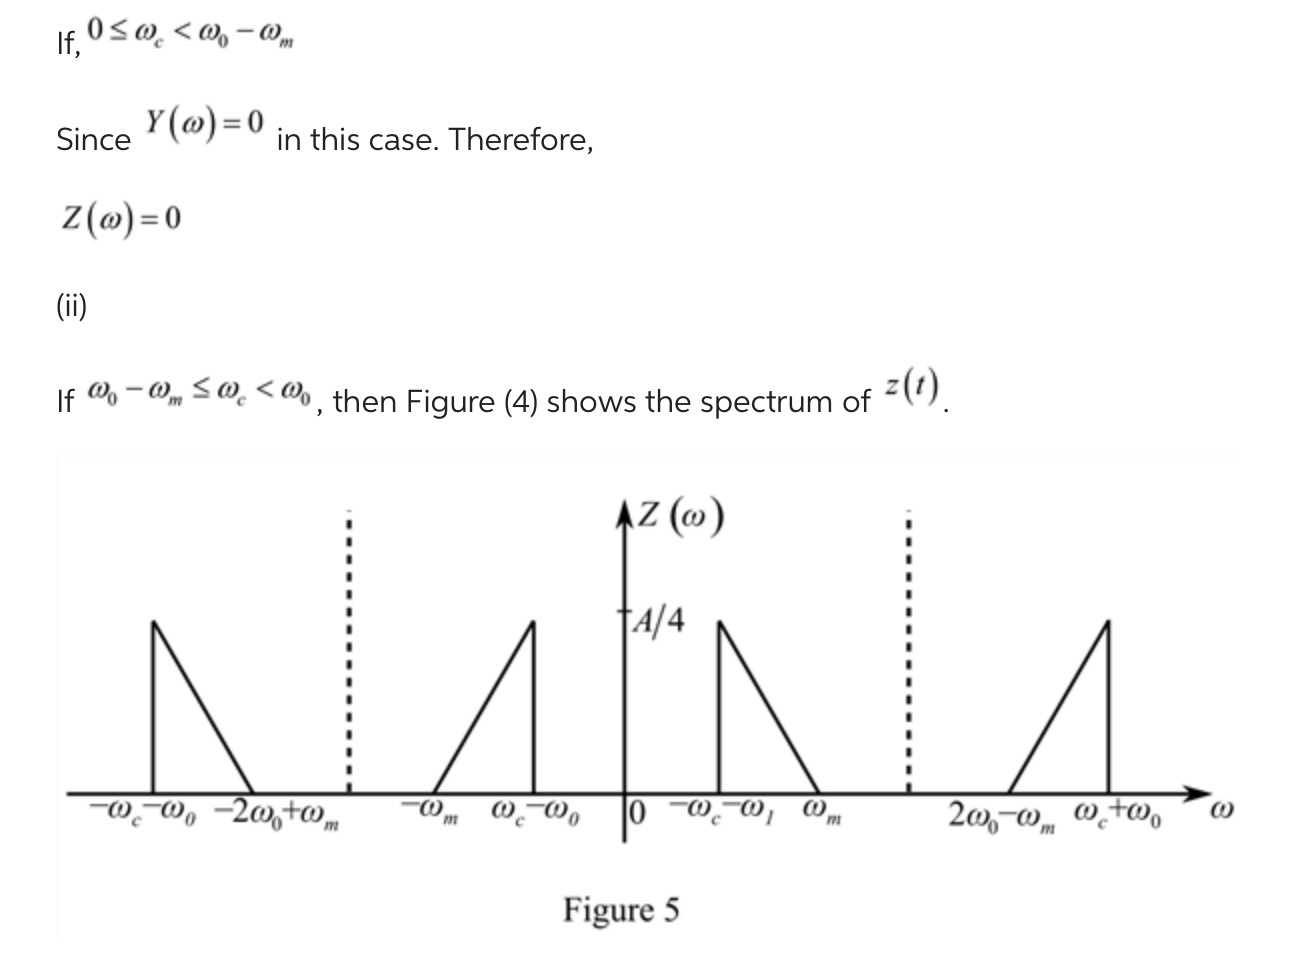
Since in this case. Therefore,
ii
If then Figure shows the spectrum of
Figure
Step by Step Solution
There are 3 Steps involved in it
1 Expert Approved Answer
Step: 1 Unlock

Question Has Been Solved by an Expert!
Get step-by-step solutions from verified subject matter experts
Step: 2 Unlock
Step: 3 Unlock