

Question: I especially need help creating the excel portion, I am not fully familiar with excel. conalderino he purchane of a machlie ut a naw orn
 I especially need help creating the excel portion, I am not fully familiar with excel.
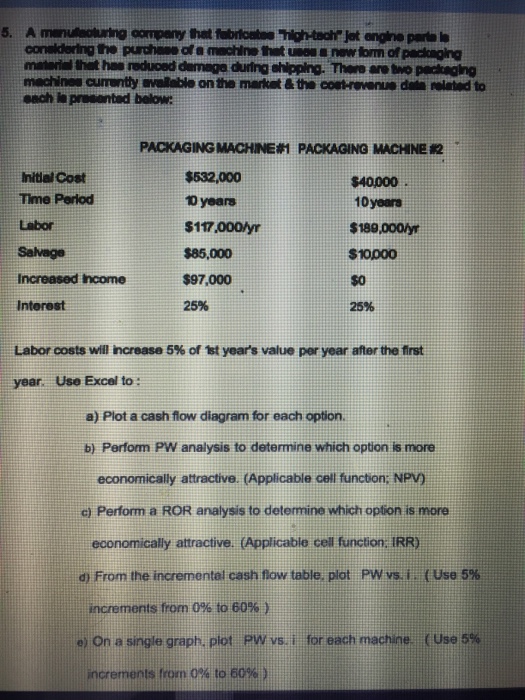
 conalderino he purchane of a machlie ut a naw orn of pacienging matavial hat han roduced damage during ehippino. Theee are two peclegino machines Currnty vellable on tho market & the cout-revanued rlatd to each ie prssented below: PACKAGING MACHINE#1 PACKAGING MACHINE 82 nitial Cost Time Period Labor Salvage Increased income Interest $532,000 10 years $117.,000/yr $85,000 $97,000 25% $40000 10 years $189.000 $10000 $O 25% Labor costs will increase 5% of 1st year's value per year after the first year. Use Excel to: a) Plot a cash flow diagram for each option b) Perform PW analysis to determine which option is more economically attractive. (Applicable cell function; NPV) c) Perform a ROR analysis to determine which option is more economically attractive. (Applicable cell function: IRR) I d) From the incremental cash flow table, plot PW vs. i . ( Use 5% increments from 0% to 60% ) e) On a single graph, plot PVV vs. i for each machine. ( Use 5% increments frorn 0% to 60%) conalderino he purchane of a machlie ut a naw orn of pacienging matavial hat han roduced damage during ehippino. Theee are two peclegino machines Currnty vellable on tho market & the cout-revanued rlatd to each ie prssented below: PACKAGING MACHINE#1 PACKAGING MACHINE 82 nitial Cost Time Period Labor Salvage Increased income Interest $532,000 10 years $117.,000/yr $85,000 $97,000 25% $40000 10 years $189.000 $10000 $O 25% Labor costs will increase 5% of 1st year's value per year after the first year. Use Excel to: a) Plot a cash flow diagram for each option b) Perform PW analysis to determine which option is more economically attractive. (Applicable cell function; NPV) c) Perform a ROR analysis to determine which option is more economically attractive. (Applicable cell function: IRR) I d) From the incremental cash flow table, plot PW vs. i . ( Use 5% increments from 0% to 60% ) e) On a single graph, plot PVV vs. i for each machine. ( Use 5% increments frorn 0% to 60%)
Step by Step Solution
There are 3 Steps involved in it

Get step-by-step solutions from verified subject matter experts