

Question: I Exercise 1: (30 points) The following table shows the average price of fresh pasteurized milk and the consumer price index from 1980 to


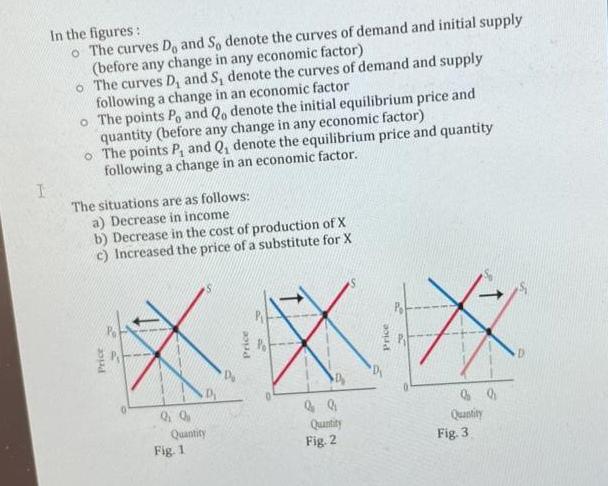
I Exercise 1: (30 points) The following table shows the average price of fresh pasteurized milk and the consumer price index from 1980 to 2010 1980 1990 IPC 82.4 Price of milk 1 liter per euro 0.38 2000 130.7 172.2 0.82 0.93 2010 218.1 1.24 a) Calculate the real price of milk in 1980 euros. Has the real price decreased, increased or stagnated since 1980? b) What is the change in the real price as a percentage (in euros from 1980) from 1980 to 2010? Exercise 2: (40 points) The following table details the quantities of soybeans that a farmer could sell at various prices. The farmer will look at his production costs and think about how much to supply following the introduction of a new strain (seed) of soybean that requires fewer pesticides. a) Define the supply curve. b) Plot the soybean supply curve for the first type of soybean. I c) Represent on the same graph the soybean supply curve for the second type of seed. d) Analyze the change in the supply curve following technological change (new seed and production cost). Price of a Kilogram of soybean $ 1.5 1.75 2.25 3 4 Quantity supplied (old seed) in kilogram 10000 20000 30000 45000 Quantity supplied (new seed) in kilogram 5000 23000 33000 40000 54000 Exercise 3: (30 points) The figures below summarize the possible changes in the supply and demand of a product X as well as the changes in the price and the equilibrium quantity. Analyze and understand each situation (changing factor) then associate it with the appropriate figure. I In the figures: o The curves Do and So denote the curves of demand and initial supply (before any change in any economic factor) o The curves D, and S, denote the curves of demand and supply following a change in an economic factor o The points Po and Qo denote the initial equilibrium price and quantity (before any change in any economic factor) o The points P, and Q, denote the equilibrium price and quantity following a change in an economic factor. The situations are as follows: a) Decrease in income b) Decrease in the cost of production of X c) Increased the price of a substitute for X Price 99 Quantity Fig. 1 Price H 99 Quantity Fig. 2 Price * Quantity Fig. 3
Step by Step Solution
3.45 Rating (155 Votes )
There are 3 Steps involved in it
Ia Lince Nominal Price Price Inden IPC Here in 1980 Nominal P... View full answer

Get step-by-step solutions from verified subject matter experts