

Question: i figured out how to do 2 and 3 but I can't figure out how to do 4 i neee help please 2 Selected comparative
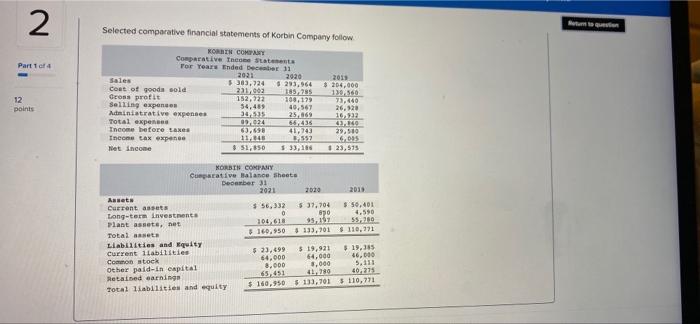
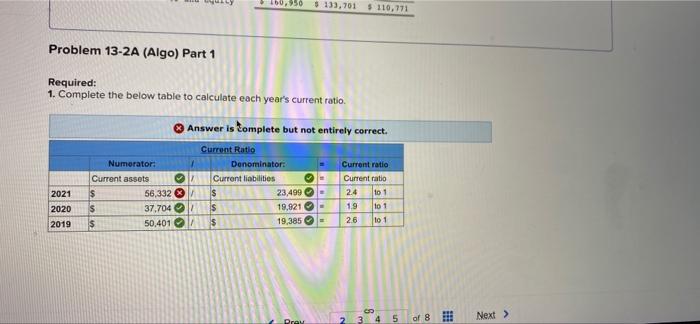
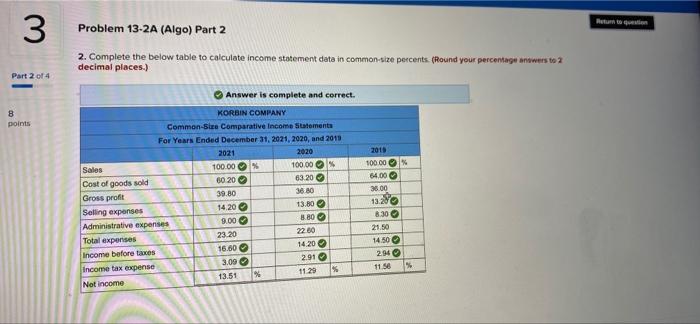
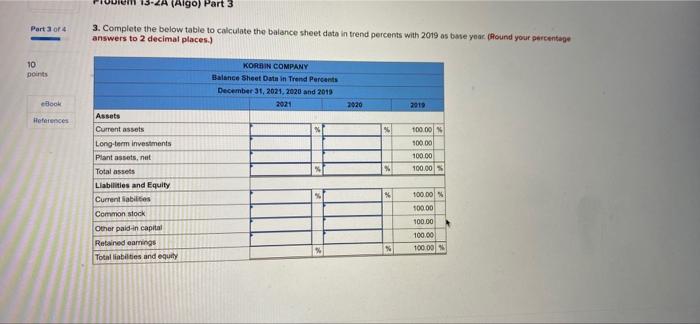
2 Selected comparative financial statements of Korbin Company follow Part 1 of 4 2011 $ 204,000 342.224 231,00 KOHEN COMPANY Comparative Inc Statements Tor Years Ended December 31 2021 2020 Sales 5 293,964 coat of goods sold 185,785 Gross profit 108.17 Selling expenses Administrative expenses 40.367 25,869 Total expen 02:24 66.435 Income before Les 63,658 41,743 Income tax expense 11048 3.552 Net Income $ 51,850 12 points 152.13 73,440 26,920 30.33 16.33 HO 29,500 6.095 123,515 KORBTN COMPANY Comparative Balance sheets December 31 2021 Assets Current assets $ 56,332 $ 37,704 $ 54,401 Long-term Investments 0 spo 4.590 plant asete, net 104.618 5.16 55.250 Total aasta $ 160,950 $ 133,701 110.271 $ Liabilities and Equity Current 1labilities $ 19,921 $ 19.385 Common stock 64.000 64.000 46,000 Other paid in capital 8.000 3.000 5.111 Retained earnings 65,451 20 40275 Total liabilities and equity $ 160,950 $ 133,701 110,71 460,950 $ 133,701 $ 110,771 Problem 13-2A (Algo) Part 1 Required: 1. Complete the below table to calculate each year's current ratio. Answer is tomplete but not entirely correct. Current Ratio Denominator: Current liabilities $ 23,499 $ 19,021- $ 19,385 Numerator: Current assets $ 56,332 / $ 37.7041 50,4011 Current ratio Current ratio 24 101 19 101 2021 2020 2019 26 to 1 23 5 Prav Next > of 8 !! 3 Problem 13-2A (Algo) Part 2 Patum te groeien 2. Complete the below table to calculate income statement data in common-size percents (Round your percentage answers to 2 decimal places.) Part 2 of 4 8. points Answer is complete and correct. KORBIN COMPANY Common-Size Comparative Income Statements For Years Ended December 31, 2021, 2020, and 2013 2021 2020 Sales 100.00% 100,00 % Cost of goods sold 6020 63.20 Gross profit 39.80 36.80 Selling expenses 14,20 13.80 Administrative expenses 9.00 8.80 Total expenses 23.20 22.80 Income before taxes 16.60 1420 Income tax expense 3.09 2.91 13.51 Not income 1129 % 2010 100.00 % 64.00 36.00 13.20 8.30 21.50 14.50 294 IS 11.50 (Algo) Part 3 Part 3 of 4 3. Complete the below table to calculate the balance sheet data in trend percents with 2019 as base yearound your percentage answers to 2 decimal places.) 10 points KORDIN COMPANY Balance Sheet Data in Trend Percents December 31, 2021, 2020 and 2019 2021 Book 2020 2010 Heferences 100.00 100.00 100.00 100.00 Assets Current assets Long-term investments Plant assets.net Total assets Liabilities and Equity Current liabile Common stock Other paid in capital Retained earnings Total liabilities and equity 100.00 100.00 100.00 100.00 100.00
Step by Step Solution
There are 3 Steps involved in it

Get step-by-step solutions from verified subject matter experts