

Question: I, for some reason, cannot pinpoint where exactly this pretax income (income before taxes) comes from. Been doing what my professor says word for word
I, for some reason, cannot pinpoint where exactly this pretax income (income before taxes) comes from. Been doing what my professor says word for word but I'm trapped. This comes from USAT's income statement on WSJ. If you need more information I will provide it. What I have is wrong
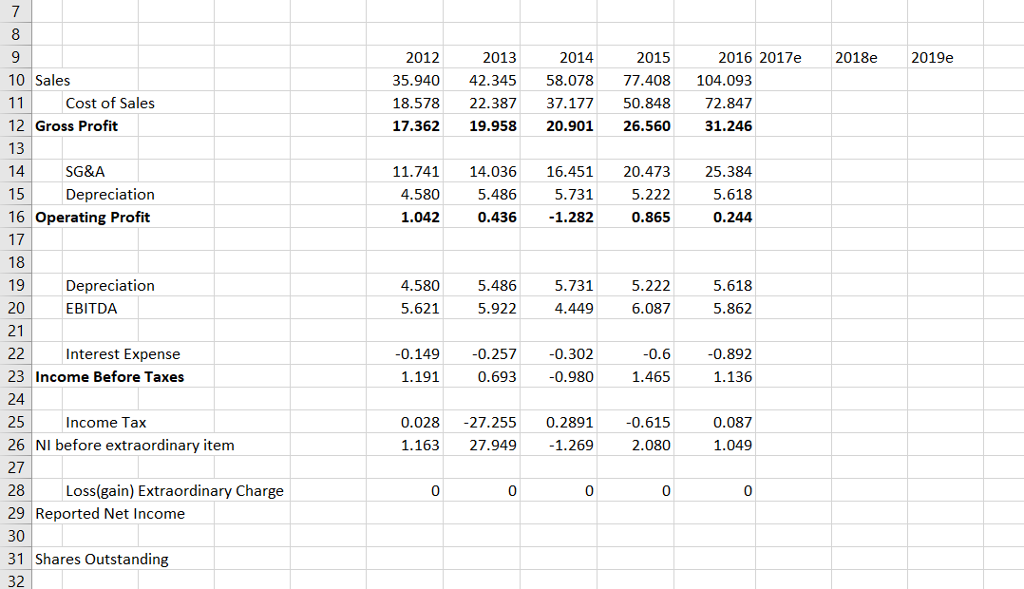
Below is what I grabbed from WSJ's annual income statement for USAT. The pretax income shown here is what I am trying to get on my pro-forma. But no matter what I do I just can't get it
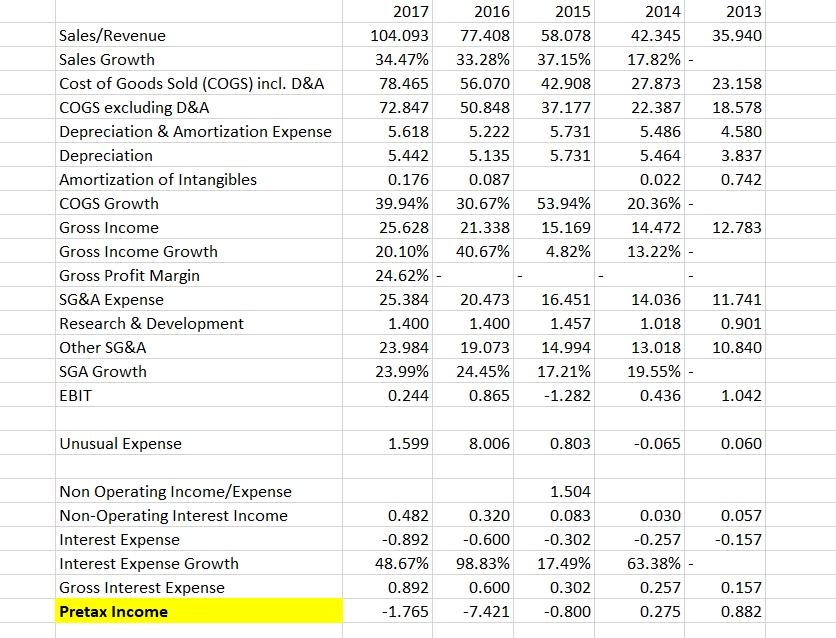
2014 35.940 42.345 58.078 77.408 104.093 18.57822.387 37.177 50.84872.847 2012 2013 2015 2016 2017e 2018e 2019e 10 Sales Cost of Sales 12 Gross Profit 13 17.362 19.958 20.901 26.560 31.246 25.384 5.618 0.244 SG&A 11.74114.036 16.451 20.473 5.222 0.865 15 Depreciation 4.580 5.486 5.731 16 Operating Profit 1.042 0.436 -1.282 18 19 20 21 22 Interest Expense 23 Income Before Taxes 24 25 26 NI before extraordinary item 27 28 Loss(gain) Extraordinary Charge 29 Reported Net Incom 30 31 Shares Outstanding 32 Depreciation EBITDA 4.580 5.621 5.486 5.922 5.731 4.449 5.222 6.087 5.618 5.862 0.149 -0.257 1.191 0.302 0.980 -0.6 0.892 1.136 0.693 1.465 0.087 1.049 Income Tax 0.028 27.255 0.2891 -0.615 1.16327.949-1.269 2.080 0 0 0 0 0 2015 104.09377.408 58.078 37.15% 78.46556.070 42.908 72.84750.848 37.177 5.731 5.731 2017 2016 2014 2013 Sales/Revenue Sales Growth Cost of Goods Sold (COGS) incl. D&A COGS excluding D&A Depreciation & Amortization Expense Depreciation Amortization of Intangibles COGS Growth Gross Income Gross Income Growth Gross Profit Margin SG&A Expense Research & Development Other SG&A SGA Growth EBIT 42.34535.940 34.47% 33.28% 17.82% 5.618 5.442 0.176 39.94% 5.222 5.135 0.087 30.67% 5.486 5.464 0.022 20.36% 27.87323.158 22.387 18.578 4.580 3.837 0.742 53.94% 5.628 21.338 15.169 4.82% 14.472 12.783 20.10% 40.67% 13.22% 24.62% 25.384 20.473 16.451 1.457 23.984 19.073 14.994 17.21% 0.865 -1.282 14.03611.741 0.901 13.018 10.840 1.400 1.400 1.018 23.99% 0.244 24.45% 19.55% 0.436 1.042 Unusual Expense 1.599 8.006 0.803 0.065 0.060 Non Operating Income/Expense Non-Operating Interest Income Interest Expense Interest Expense Growth Gross Interest Expense Pretax Income 1.504 0.083 0.302 17.49% 0.302 0.800 0.030 0.257 63.38% 0.257 0.275 0.482 0.320 0.600 98.83% 0.600 0.057 0.892 0.157 48.67% 0.892 0.157 0.882 1.765-7.421 -0
Step by Step Solution
There are 3 Steps involved in it

Get step-by-step solutions from verified subject matter experts