

Question: I forgot how to do these problems. Please solve with steps In a church Indoors but not in a church Outdoors Total Observed freq (10
I forgot how to do these problems. Please solve with steps
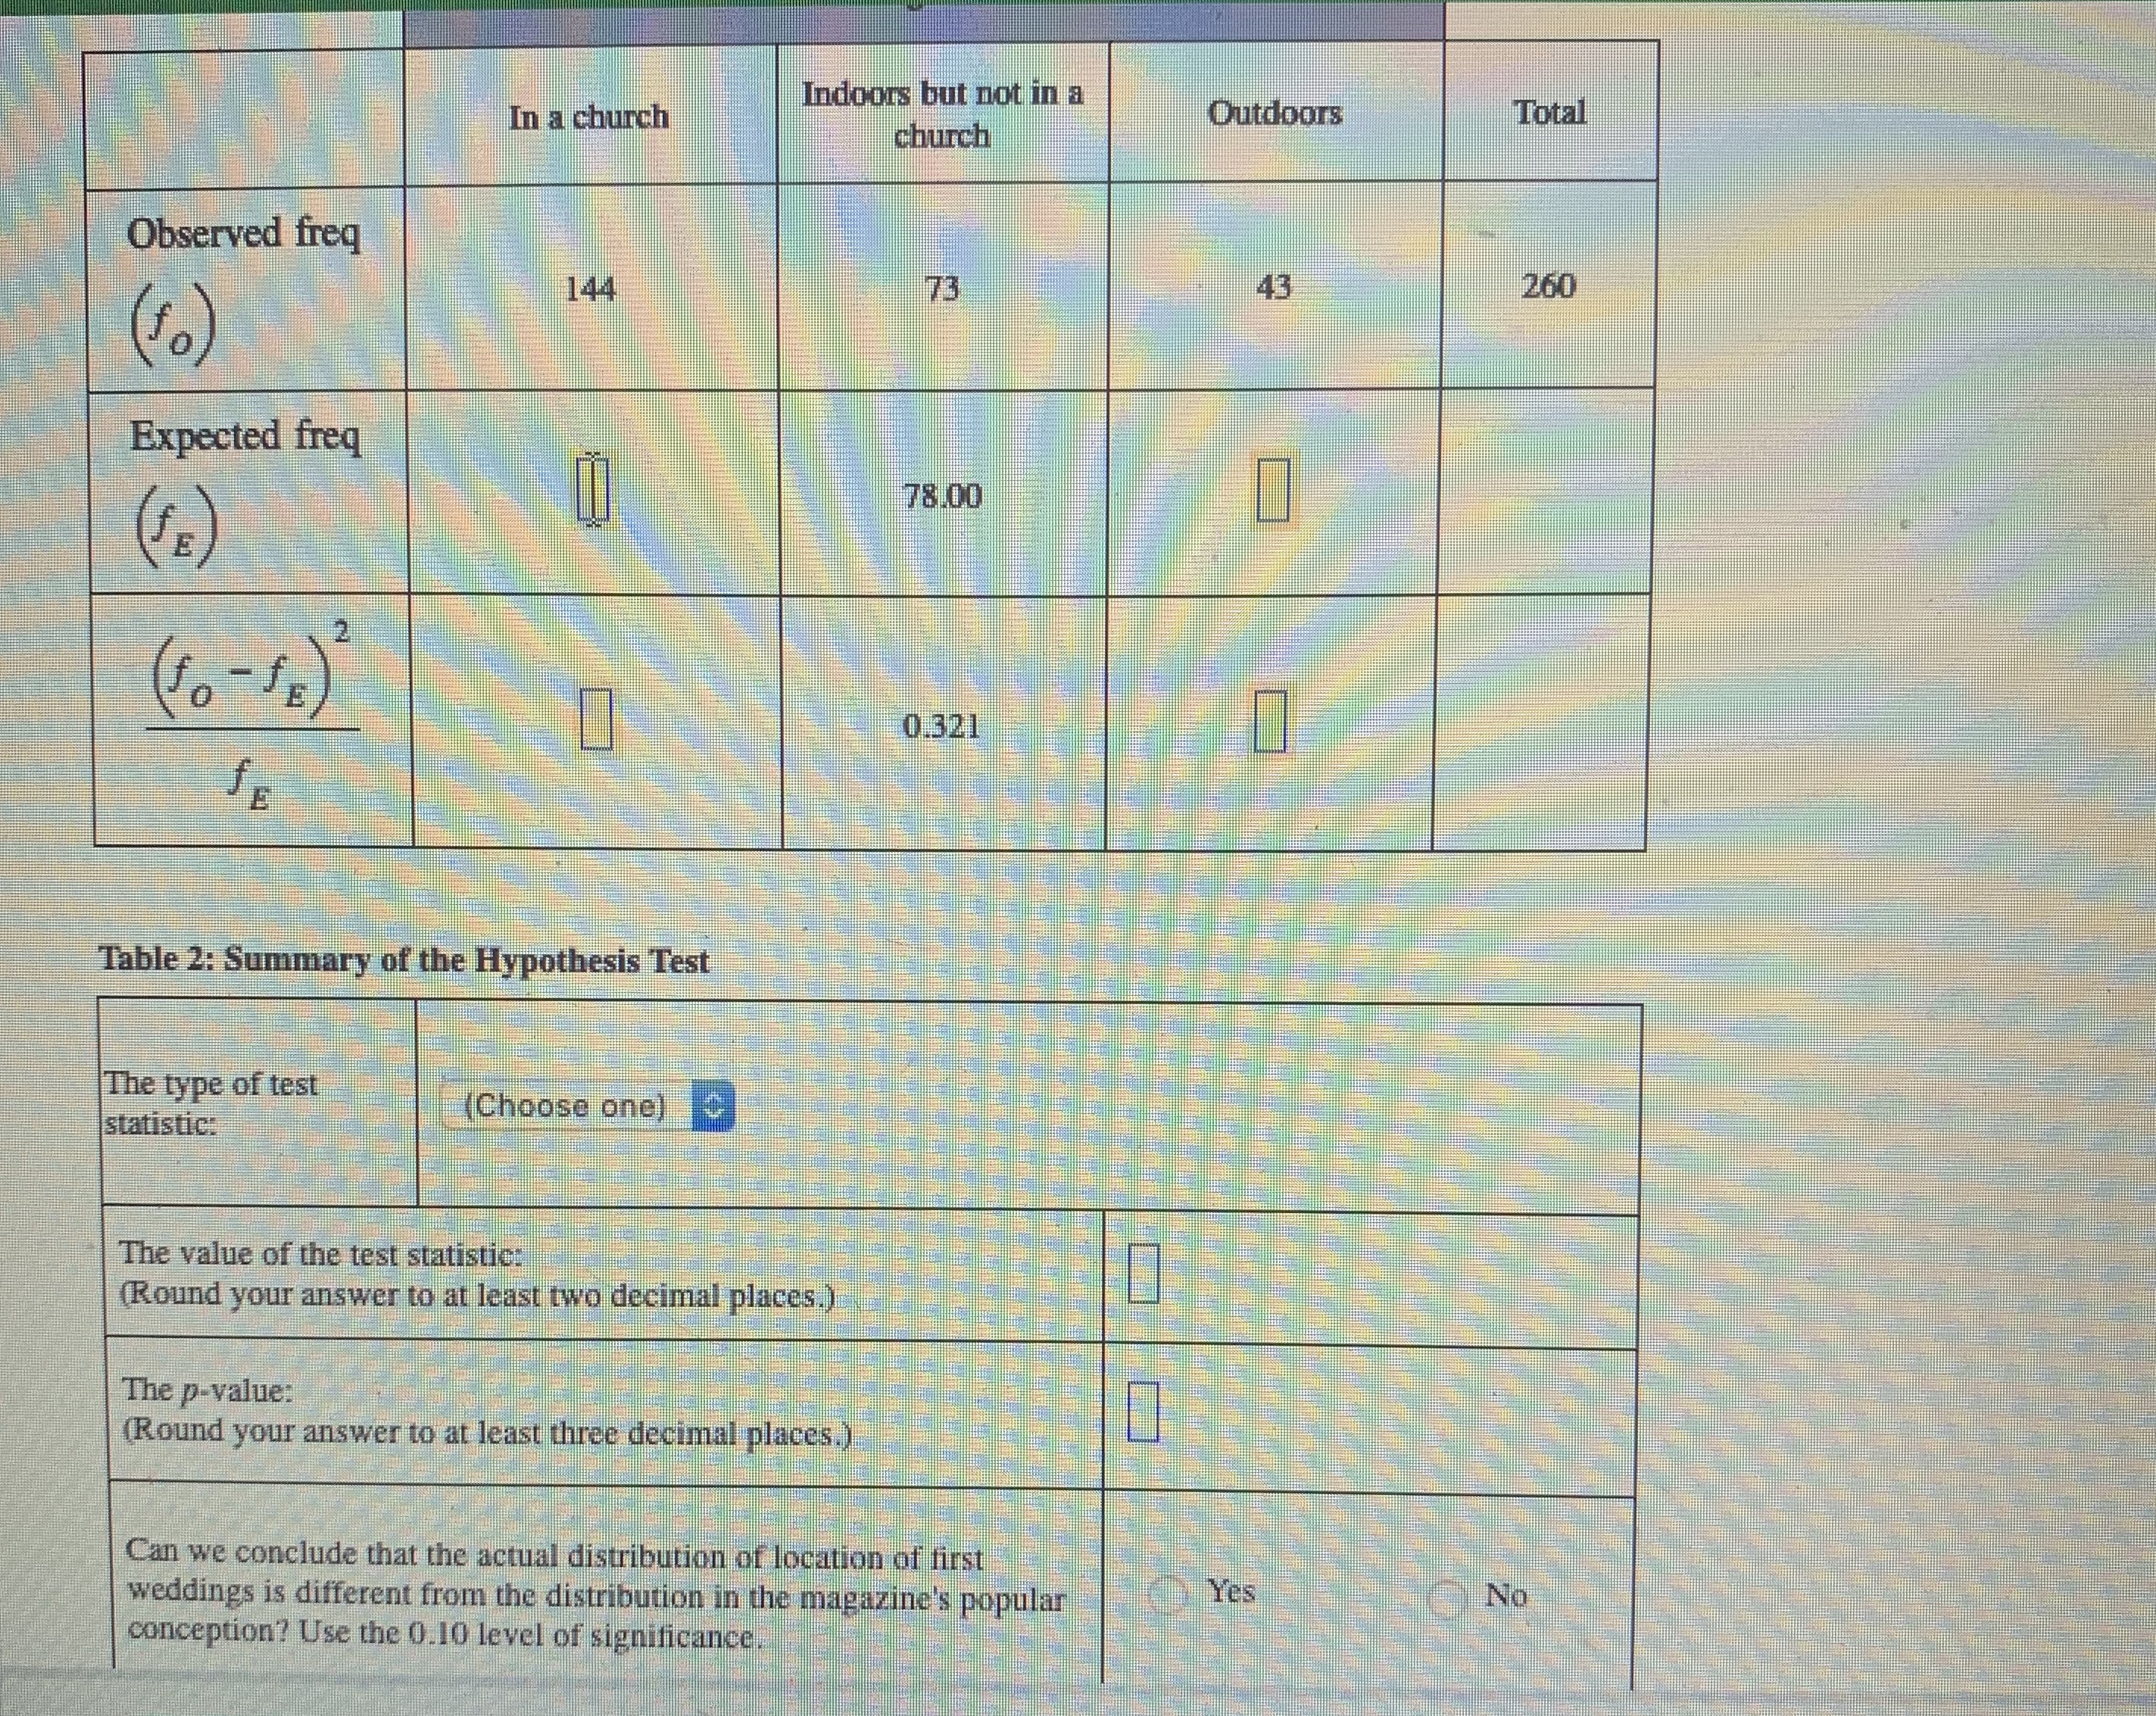
In a church Indoors but not in a church Outdoors Total Observed freq (10 ) 144 73 43 260 Expected freq (FE ) 78.00 (10 - 18 ) 0.321 Table 2: Summary of the Hypothesis Test The type of test statistic: (Choose one) The value of the test statistics (Round your answer to at least two decimal places.) The p-value: (Round your answer to at least three decimal places.) Can we conclude that the actual distribution of location of first weddings is different from the distribution in the magazine's popular Yes No conception? Use the 0.10 level of significance.Matrimony Monthly is a top-selling magazine that provides information for couples thinking about marriage. Over the years, writers for the magazine have researched just about everything there is to research about weddings. The popular conception at the magazine has been that roughly 50 % of first weddings take place indoors in a church, 30 % take place indoors in a building other than a church, and 20% take place outdoors. This past week, the magazine examined a random sample of 260 first weddings and found the distribution given in the first row of numbers in Table 1 below. (This row contains the frequencies observed in their sample of 260.) The second row of numbers in Table 1 gives the frequencies expected under the hypothesis that the popular conception at the magazine is correct. The bottom row of numbers in Table 1 contains the values (fo -fe ) (Observed frequency - Expected frequency)2 SE Expected frequency for each of the wedding location categories. There is now some disagreement among employees of the magazine. Some say that this sample demonstrates that the actual location distribution of first weddings is different from that in the magazine's popular conception; others maintain that the sample data accord with the magazine's popular conception and that any differences between the two are due to chance. Fill in the missing values of Table 1. Then, using the 0.10 level of significance, perform a test of the hypothe tual distribution of first wedding locations matches the distribution in the magazine's popular conception. Then complete Table 2. Round your responses for the expected frequencies in Table 1 to at least two decimal places. Round your ( fo fE ) fE responses in Table 1 to at least three decimal places. Round your responses in Table 2 as specified. The ilder Table 1: Information about the Sample Wedding location Submit Assignment 2019 McGraw-Hill Education. All Rights Res sibility S esc F1 F2 F3 8 8 8 F4 F5 F7 I F8 44 F10 2 W Q W E R T Y U O P A S D F G H K Z X C B N M alt 96 9.P alt option command command option
Step by Step Solution
There are 3 Steps involved in it

Get step-by-step solutions from verified subject matter experts