

Question: i found some difficulties to anwer the question, please help to answer the question Descriptive Statistics Mean Sid. Deviation positive_rate 04209 .016307 66 new cases
i found some difficulties to anwer the question, please help to answer the question
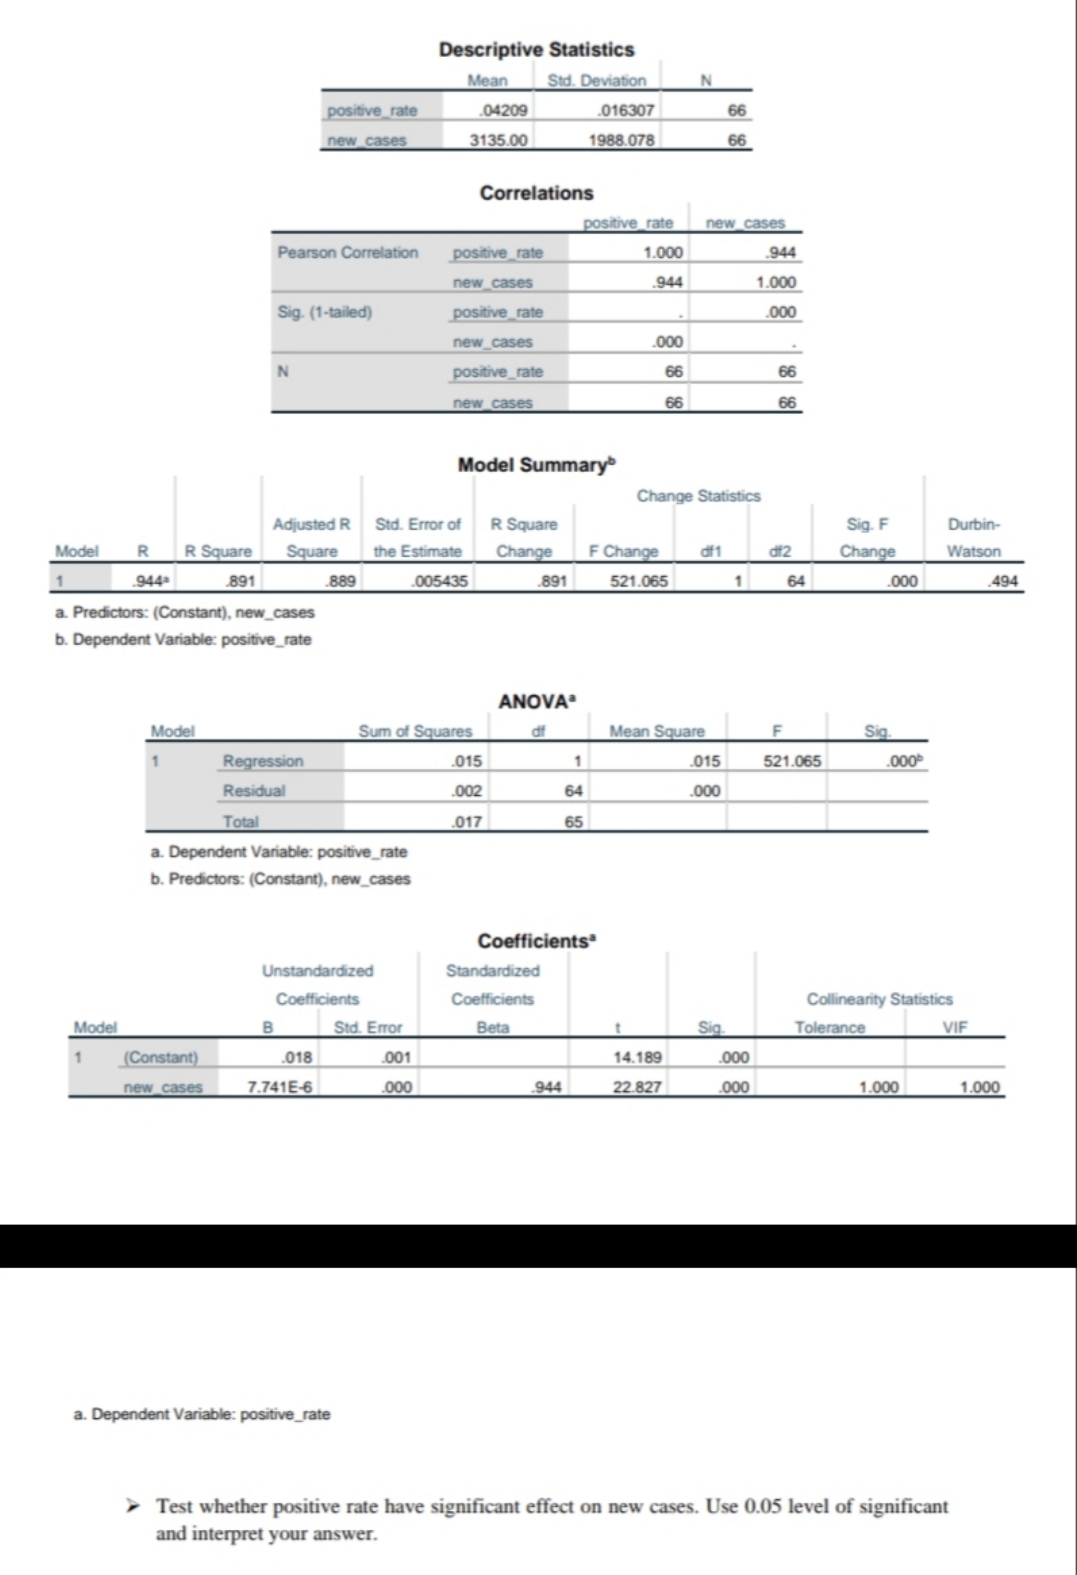
Descriptive Statistics Mean Sid. Deviation positive_rate 04209 .016307 66 new cases 3135.00 1988.078 66 Correlations positive rate new cases Pearson Correlation positive_rate 1.000 .944 new cases 944 1.000 Sig. (1-tailed) positive_rate 000 new_cases .000 positive_rate 66 66 new cases 66 66 Model Summary Change Statistics Adjusted R Std. Error of R Square Sig. F Durbin- Model R R Square Square the Estimate Change F Change dif 1 dif2 Change Watson 944 891 889 005435 .891 521.065 64 .000 494 a. Predictors: (Constant), new_cases b. Dependent Variable: positive_rate ANOVA Model Sum of Squares Mean Square Sig Regression .015 015 521.065 000 Residual .002 64 .000 Total .017 65 a. Dependent Variable: positive_rate b. Predictors: (Constant), new_cases Coefficients" Unstandardized Standardized Coefficients Coefficients Collinearity Statistics Model B Std. Error Beta Sig Tolerance VIF (Constant) 018 001 14.189 OOO new cases 7.741E-6 000 .944 22.827 000 1.000 1.000 a. Dependent Variable: positive_rate > Test whether positive rate have significant effect on new cases. Use 0.05 level of significant and interpret your
Step by Step Solution
There are 3 Steps involved in it

Get step-by-step solutions from verified subject matter experts