

Question: I got the output, I just need help commenting and writing the conclusions on it. I can provide Two_Sample_data, if you need Your earliest help
I got the output, I just need help commenting and writing the conclusions on it.
I can provide Two_Sample_data, if you need
Your earliest help would be much appreciated
This is due in an hour. Thanks
2- (Use the data in the file "Two_Samples_data" to answer this question)
? The column "Grade" contains the grades of 110 Online and 108 In person students selected randomly and independently from students registered in the two versions of the course. The variable "Section" shows in which version they are registered. "A" means the student registered Online and "B" means the student is registered in the In person version.
At level ? = 0.05, do the data support the hypothesis that the true average grades in both versions of the course are equal? I.e., if we let ??, ?? be the true average grades of the Online and the In person versions of the course, then we are interested in testing
{ ?0: ??? ??= 0
{ ??: ??? ??? 0
Write down your conclusion by comparing your P-value to 0.05. Also include final SPSS output.
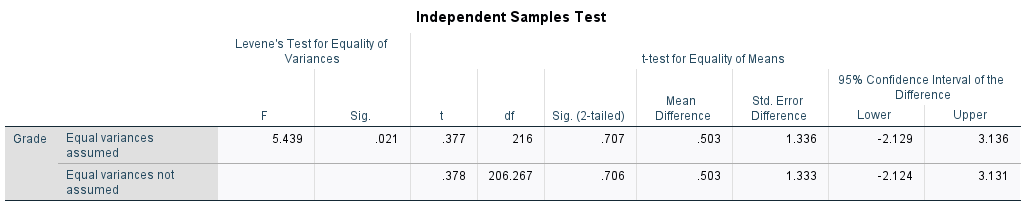
Independent Samples Test Levene's Test for Equality of Variances t-test for Equality of Means 95% Confidence Interval of the Mean Std. Error Difference F Sig. + df Sig. (2-tailed) Difference Difference Lower Upper Grade Equal variances 5.439 021 377 216 707 503 1.336 -2.129 3.136 assumed Equal variances not 378 206.267 .706 .503 1.333 -2.124 3.131 assumed
Step by Step Solution
There are 3 Steps involved in it

Get step-by-step solutions from verified subject matter experts