

Question: I had provided below Table I - A and table 1 and we need to answer these questions a . Have banks' returns on assets
I had provided below Table IA and table and we need to answer these questions
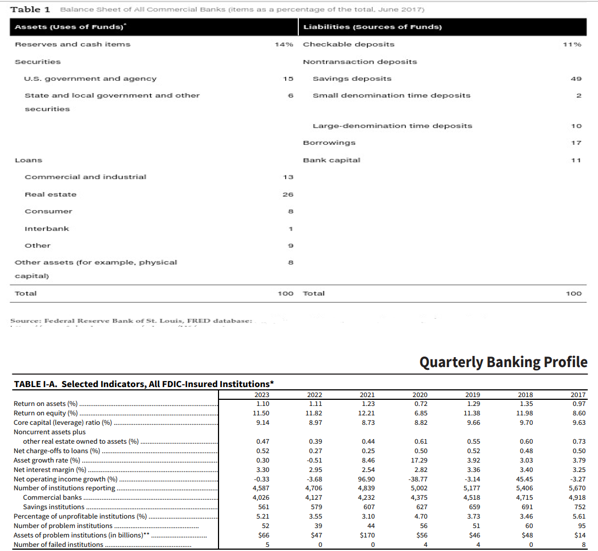
a Have banks' returns on assets been increasing or decreasing over the past few years?
b Has the core capital been increasing, and how does it compare to the capital ratio reported in Table of the text?
c How many institutions are currently reportingtotheFDIC
Table Ealance sheet of All Commercial Banks items as a percentage of the total, June
tableAssets Uses of PundsLiabilities sourees of rundsReserves and cash items,Checkable deposits,EecuritiesNontransaction deposits,Us government and agency,Gavings deposits,tablestate and losecuritiesSmall denomination time deposits,Largedenomination time deposits,Borrowings,LoansBank capital,Commercial and industrial,Real estate,InterbankotherOther assets ffor example, physical,capitalyTotalTotal,
Sources Federal Itewerve Bank of St Louis, FhED database:
Quarterly Banking Profile
TABLE IA Selected Indicators, All FDICInsured Institutions
tableReturn on assets Return on equity NGCore capital leverage ratio Noncurrent assets plus,,,,,,,other real estate owned to assets Asset growth rate Net interest margin Net operating income growth uuaCommercial banks Savings institutions Percentage of unprofitable institutions Number of problem institutions Assets of problem institutions in billions$$$
Step by Step Solution
There are 3 Steps involved in it
1 Expert Approved Answer
Step: 1 Unlock

Question Has Been Solved by an Expert!
Get step-by-step solutions from verified subject matter experts
Step: 2 Unlock
Step: 3 Unlock