

Question: I have a data analysis for a statistic class, and I need help on part 3 on the calculation and the discussion of these results.
I have a data analysis for a statistic class, and I need help on part 3 on the calculation and the discussion of these results.
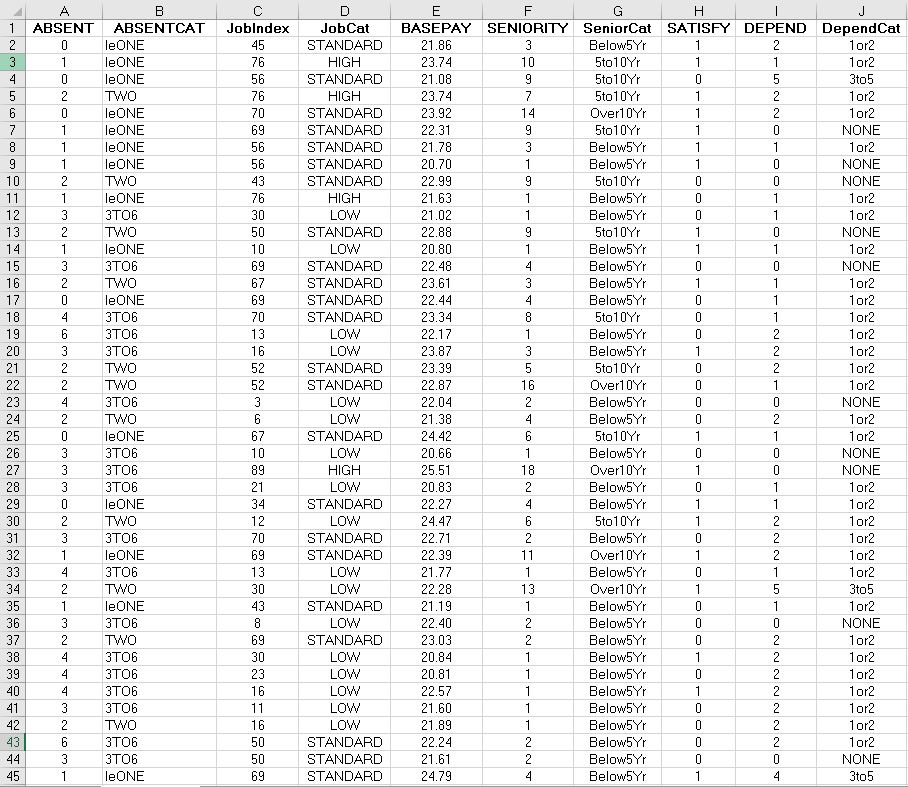
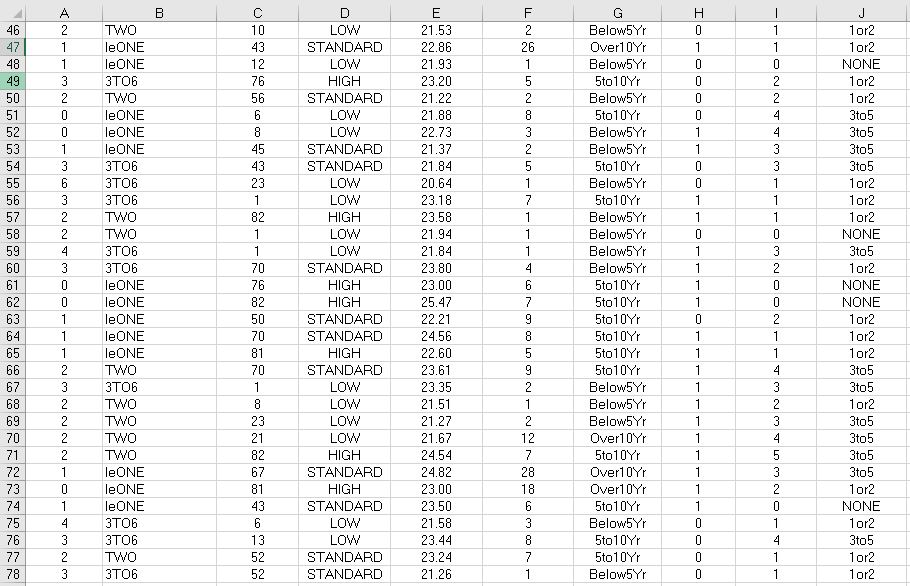
Develop and discuss in the context of the problem the 95% confidence interval estimates for absentees from work (ABSENT) for
a. all employees;
b. employees from each job complexity categories;
c. employees from each supervisor satisfaction categories.
My results are:
a. We are 95% confident that the number of absenteeism for all employees ranges from [0.4143, 0.8000] for 0 to 1 occasion, [2, 2] for 2 occasions, and [3.2364, 3.9779] occasions.
b. We are 95% confident that the employees from each job complexity category ranges from [9.7890, 16.1465] for low complexity, [53.4641, 61.1645] for standard complexity, and [76.9235, 82.5310] for high complexity.
c. We are also 95% confident that the satisfaction level of employees from each supervisor satisfaction category ranges from [0.3586, 0.6803] and the dissatisfaction level ranges from [0.3518, 0.6872].
The calculation that I did, did not have a correlation with the other parts that my teammates have for Part 1, 2 & 4. Hence, I don't know how to do it and how to discuss those results.
\f\f\f\f
Step by Step Solution
There are 3 Steps involved in it

Get step-by-step solutions from verified subject matter experts