

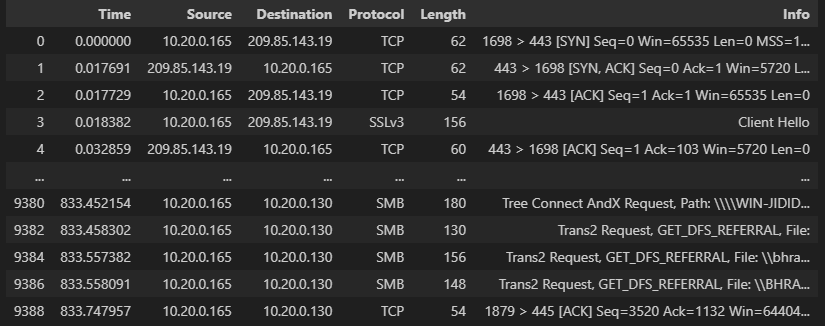
Question: I have a dataset like in the image. The question is how to get the total number of packets and use it to plot a
I have a dataset like in the image. The question is how to get the total number of packets and use it to plot a line chart that depicts "Seconds" AND "Total Number of Packets" on xaxis and yaxis respectively
Step by Step Solution
There are 3 Steps involved in it
1 Expert Approved Answer
Step: 1 Unlock

Question Has Been Solved by an Expert!
Get step-by-step solutions from verified subject matter experts
Step: 2 Unlock
Step: 3 Unlock