

Question: I have a excel file, I need to plot this data using MATLAB. I would like to plot the x-axis in 10 minute intervals from
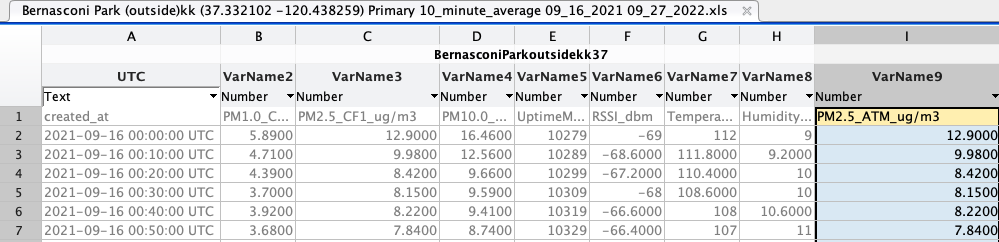 I have a excel file, I need to plot this data using MATLAB. I would like to plot the x-axis in 10 minute intervals from 2021-09-16:0:000 UTC to 2022-08-10 12:50:00 UTC. First how would I go about to make an x-axis with that timeframe. Lastly, how would I plot concentration using column I VarName9?
Bernasconi Park (outside)kk (37.332102 -120.438259) Primary 10_minute_average 09_16_2021 09_27_2022.xls
Step by Step Solution
There are 3 Steps involved in it
1 Expert Approved Answer
Step: 1 Unlock

Question Has Been Solved by an Expert!
Get step-by-step solutions from verified subject matter experts
Step: 2 Unlock
Step: 3 Unlock