

Question: I have a final project on Forecasting (5yrs) Business Plan on Financial Chapter. please help me figure out what is wrong on my Balance Sheet
I have a final project on Forecasting (5yrs) Business Plan on Financial Chapter. please help me figure out what is wrong on my Balance Sheet it won't balance my Total Assets and Liabilities plus Equity. Take your time I'll give you positive remarks. Thank you so much
Income Statement
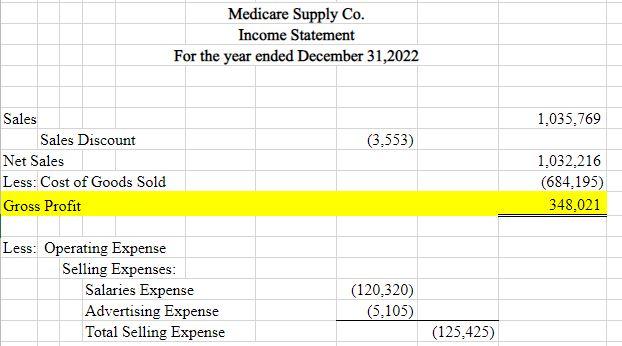
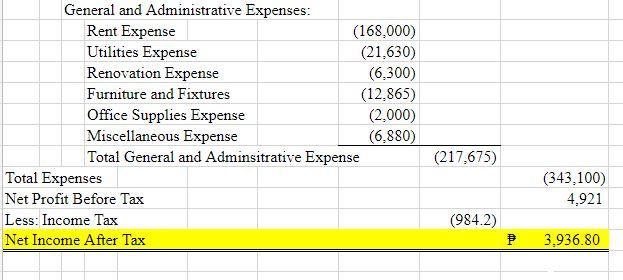
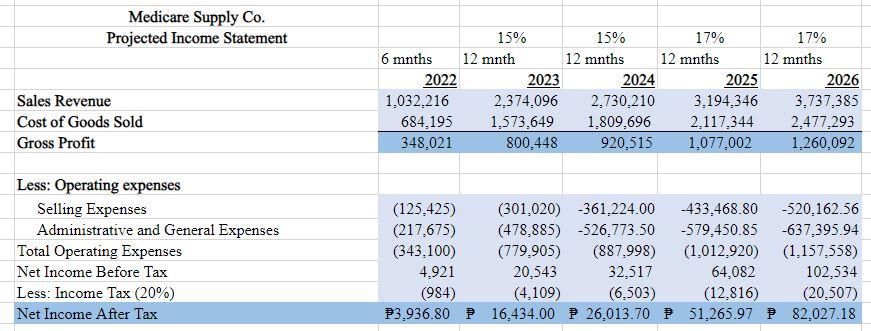
For reference our increasing CoGS and Sales 15% (year 2023-24) 17% (year 2025-26)
Selling Expenses annually increasing 20% then Administrative & General Expenses with 10%
We come up 2,374,096 in sales revenue by (1.032,216 * 2) for the total of 12 months then increase with 15%
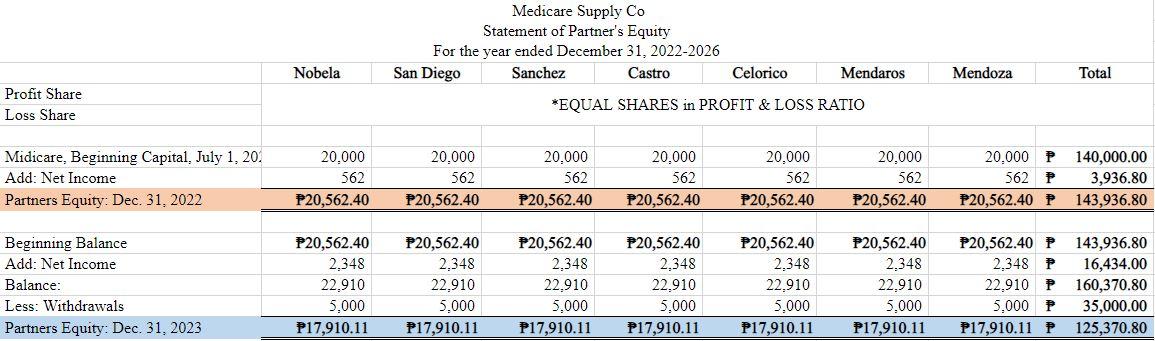
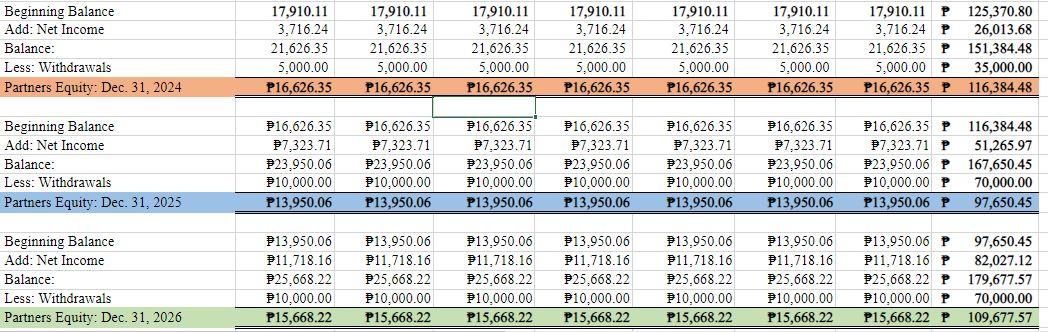
Statement of Partners' Equity
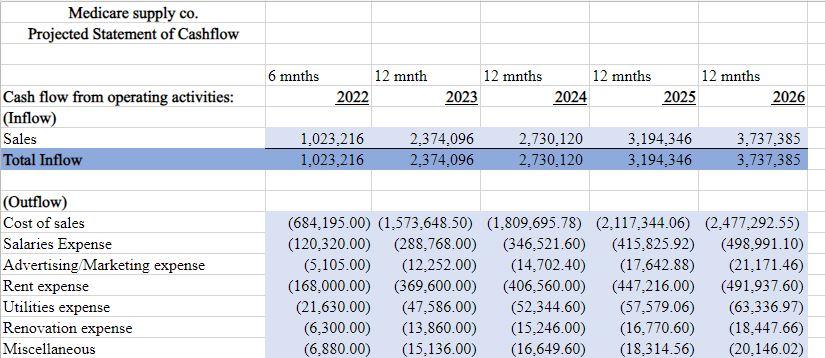
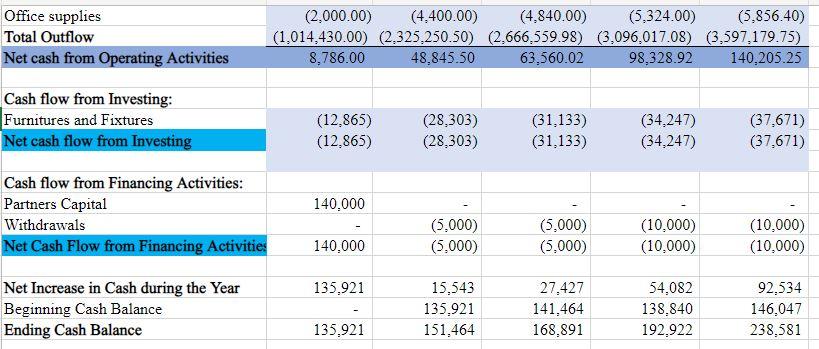
CASH FLOW
BALANCE SHEET
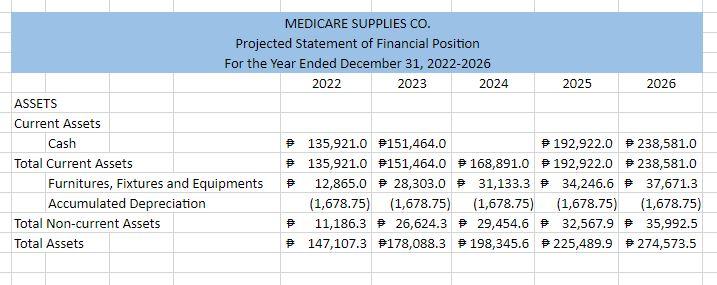
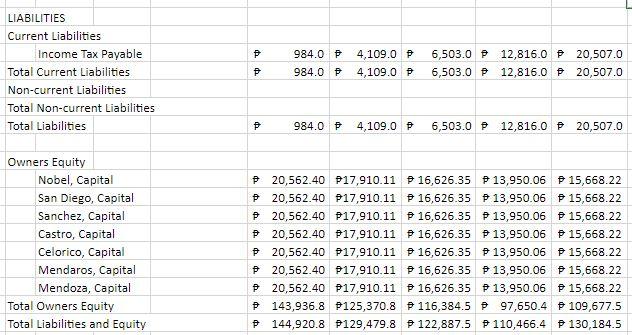
Medicare Supply Co. Income Statement For the year ended December 31,2022 1,035,769 (3.553) Sales Sales Discount Net Sales Less: Cost of Goods Sold Gross Profit 1.032.216 (684,195) 348,021 Less: Operating Expense Selling Expenses: Salaries Expense Advertising Expense Total Selling Expense (120,320) (5.105) (125,425) General and Administrative Expenses: Rent Expense (168.000) Utilities Expense (21,630) Renovation Expense (6.300) Furniture and Fixtures (12,865) Office Supplies Expense (2.000) Miscellaneous Expense (6.880) Total General and Adminsitrative Expense Total Expenses Net Profit Before Tax Less: Income Tax Net Income After Tax (217,675) (343,100) 4,921 (984.2) 3.936.80 Medicare Supply Co. Projected Income Statement 15% 15% 17% 17% 6 mnths 12 mnth 12 mnths 12 mnths 12 mnths 2022 2023 2024 2025 2026 1,032,216 2,374,096 2,730,210 3,194,346 3.737,385 684,195 1,573,649 1,809.696 2.117,344 2,477,293 348,021 800,448 920,515 1,077,002 1,260,092 Sales Revenue Cost of Goods Sold Gross Profit Less: Operating expenses Selling Expenses Administrative and General Expenses Total Operating Expenses Net Income Before Tax Less: Income Tax (20%) Net Income After Tax (125,425) (301,020) -361,224.00 -433,468.80 -520.162.56 (217,675) (478,885) -526,773.50 -579.450.85 -637.395.94 (343,100) (779,905) (887,998) (1,012.920) (1.157,558) 4.921 20,543 32,517 64,082 102,534 (984) (4.109) (6,503) (12.816) (20,507) 23.936.80 16.434.00 26,013.70 51,265.97 82.027.18 Depreciation Expense - Furnitures, Fixtures and Equipments Cost Useful Life 2025 2026 DEPRECIATION 2023 2024 600.00 600.00 638.75 638.75 600.00 600.00 2022 600.00 638.75 200.00 12 638.75 Printer Customized Stall Ceiling Fan Drawer Cash Box 638.75 3,000 7,665 1,000 1,200 12,865.00 200 240 1,678.75 200 240 1,678.75 200 240 240.00 1,678.75 200 240 1,678.75 1,678.75 Medicare Supply Co Statement of Partner's Equity For the year ended December 31, 2022-2026 San Diego Sanchez Castro Celorico Mendaros *EQUAL SHARES in PROFIT & LOSS RATIO Nobela Mendoza Total Profit Share Loss Share Midicare, Beginning Capital, July 1, 20. Add: Net Income Partners Equity: Dec 31, 2022 20.000 562 P20,562.40 20.000 562 P20,562.40 20.000 562 P20,562.40 20,000 562 P20,562.40 20,000 562 P20,562.40 20,000 562 P20,562.40 20.000 P 562 P P20,562.40 P 140,000.00 3,936.80 143,936.80 Beginning Balance Add: Net Income Balance: Less: Withdrawals Partners Equity: Dec 31, 2023 P20,562.40 2,348 22.910 5,000 P17,910.11 P20,562.40 2,348 22,910 5,000 P17,910.11 P20,562.40 2,348 22,910 5.000 P17,910.11 P20,562.40 2.348 22,910 5.000 P17,910.11 P20,562.40 2,348 22,910 5.000 P17,910.11 P20,562.40 2,348 22,910 5.000 P17,910.11 P20,562.40 P 2.348 P 22.910 P 5.000 P P17,910.11 P 143,936.80 16,434.00 160,370.80 35,000.00 125,370.80 Beginning Balance Add: Net Income Balance: Less: Withdrawals Partners Equity: Dec. 31, 2024 17,910.11 3,716.24 21,626.35 5,000.00 P16,626.35 17,910.11 3,716.24 21,626.35 5,000.00 P16,626.35 17,910.11 3,716.24 21,626.35 5,000.00 P16,626.35 17,910.11 3,716.24 21,626.35 5,000.00 P16,626.35 17,910.11 3,716.24 21,626.35 5,000.00 P16,626.35 17,910.11 3,716.24 21.626.35 5.000.00 P16,626.35 17,910.11 P 3.716.24 P 21,626.35 P 5,000.00 P P16,626.35 P 125,370.80 26,013.68 151,384.48 35,000.00 116,384.48 Beginning Balance Add: Net Income Balance: Less: Withdrawals Partners Equity: Dec 31, 2025 16.626.35 7,323.71 23,950.06 P10,000.00 P13,950.06 16.626.35 7,323.71 23,950.06 10,000.00 P13,950.06 16,626.35 27.323.71 23,950.06 10,000.00 P13,950.06 16,626.35 27,323.71 23,950.06 10,000.00 P13,950.06 16,626.35 27,323.71 23,950.06 10,000.00 P13,950.06 P16,626.35 7,323.71 23,950.06 P10,000.00 P13,950.06 P16.626.35 P 116,384.48 27.323.71 P 51,265.97 P23.950.06 P167,650.45 P10,000.00 P 70,000.00 P13,950.06 P 97,650.45 Beginning Balance Add: Net Income Balance: Less: Withdrawals Partners Equity: Dec 31, 2026 P13.950.06 P11,718.16 25,668.22 10,000.00 P15,668.22 213,950.06 11,718.16 P25,668.22 P10,000.00 P15,668.22 P13.950.00 P11,718.16 25.668.22 P10,000.00 P15,668.22 P13,950.06 P11,718.16 25,668.22 P10,000.00 P15,668.22 13,950.06 11,718.16 25,668.22 P10,000.00 P15,668.22 P13,950.06 11,718.16 P25,668.22 P10,000.00 P15,668.22 213.950.06 P 97,650.45 11,718.16 P 82,027.12 25.668.22 P 179,677.57 P10,000.00 P 70,000.00 P15,668.22 P 109,677.57 Medicare supply co. Projected Statement of Cashflow 6 mnths 12 mnth 2022 12 mnths 2023 12 mnths 2024 12 mnths 2025 2026 Cash flow from operating activities: (Inflow) Sales Total Inflow 1,023,216 1,023,216 2,374,096 2,374,096 2,730,120 2.730.120 3.194,346 3,194,346 3,737,385 3,737,385 (Outflow) Cost of sales Salaries Expense Advertising Marketing expense Rent expense Utilities expense Renovation expense Miscellaneous (684,195.00) (1,573,648.50) (1.809,695.78) (2,117,344.06) (2.477.292.55) (120,320.00) (288,768.00) (346,521.60) (415.825.92) (498,991.10) (5.105.00) (12,252.00) (14,702.40) (17.642.88) (21.171.46) (168.000.00) (369,600.00) (406,560.00) (447,216.00) (491,937.60) (21.630.00) (47,586.00) (52.344.60) (57,579.06) (63,336.97) (6,300.00) (13,860.00) (15,246.00) (16,770.60) (18.447.66) (6.880.00) (15,136.00) (16,649.60) (18,314.56) (20.146.02) Office supplies Total Outflow Net cash from Operating Activities (2.000.00) (4.400.00) (4.840.00) (5,324.00) (5,856.40) (1,014,430.00) (2.325.250.50) (2.666,559.98) (3.096,017.08) (3,597.179.75) 8,786.00 48,845.50 63,560.02 98,328.92 140,205.25 Cash flow from Investing: Furnitures and Fixtures Net cash flow from Investing (12.865) (12.865) (28,303) (28,303) (31.133) (31.133) (34.247) (34.247) (37.671) (37.671) 140.000 Cash flow from Financing Activities: Partners Capital Withdrawals Net Cash Flow from Financing Activities (5,000) (5.000) 140,000 (5,000) (5,000) (10.000) (10,000) (10,000) (10,000) 135.921 Net Increase in Cash during the Year Beginning Cash Balance Ending Cash Balance 15,543 135.921 151.464 27,427 141,464 168,891 54,082 138,840 192.922 92.534 146,047 238,581 135,921 MEDICARE SUPPLIES CO. Projected Statement of Financial Position For the Year Ended December 31, 2022 2026 2022 2023 2024 2025 2026 ASSETS Current Assets Cash 135,921.0 151,464.0 192,922.0 238,581.0 Total Current Assets 135,921.0 151,464.0 168,891.0 192,922.0 238,581.0 Furnitures, Fixtures and Equipments 12,865.0 28,303.0 31,133.3 34,246.6 37,671.3 Accumulated Depreciation (1,678.75) (1,678.75) (1,678.75) (1,678.75) (1,678.75) Total Non-current Assets # 11,186.3 26,624.3 29,454.6 32,567.9 35,992.5 Total Assets 147,107.3 +178,088.3 198,345.6 225,489.9 274,573.5 LIABILITIES Current Liabilities Income Tax Payable Total Current Liabilities Non-current Liabilities Total Non-current Liabilities Total Liabilities 984.0 4,109.0 984.0 + 4,109.0 P 6,503.0 P 12,816.0 20,507.0 6,503.0 P 12,816.0 P 20,507.0 P 984.0 P 4,109.0 6,503.0 12,816.0 20,507.0 Owners Equity Nobel, Capital San Diego, Capital Sanchez, Capital Castro, Capital Celorico, Capital Mendaros, Capital Mendoza, Capital Total Owners Equity Total Liabilities and Equity P20,562.40 P17,910.11 16,626.35 P 13,950.06 15,668.22 20,562.40 P17,910.11 16,626.35 P13,950.06 15,668.22 20,562.40 P17,910.11 16,626.35 P 13,950.06 15,668.22 20,562.40 P17,910.11 16,626.35 13,950.06 15,668.22 P20,562.40 P17,910.11 16,626.35 13,950.06 15,668.22 P20,562.40 $17,910.11 16,626.35 13,950.06 15,668.22 20,562.40 P17,910.11 16,626.35 P 13,950.06 15,668.22 143,936.8 P125,370.8 116,384.5 97,650.4 109,677.5 144,920.8 P129,479.8. 122,887.5 110,466.4 130,184.5
Step by Step Solution
There are 3 Steps involved in it

Get step-by-step solutions from verified subject matter experts