

Question: i have a mac book so if please explain for a mac user. numver 7 is also all im struggling with sert Draw Design Layout
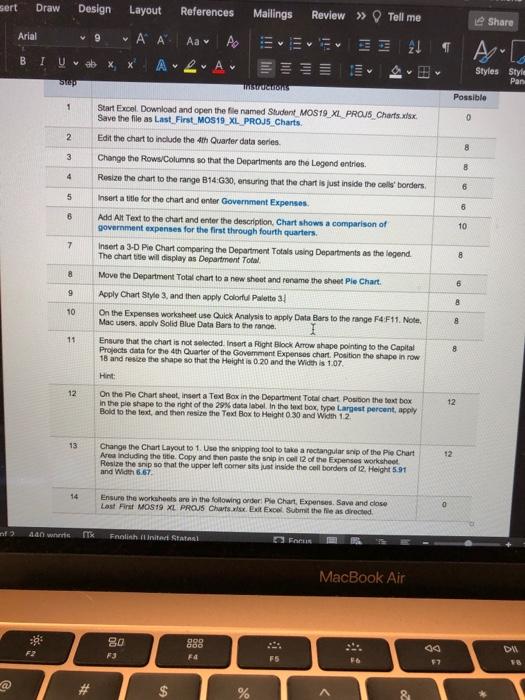
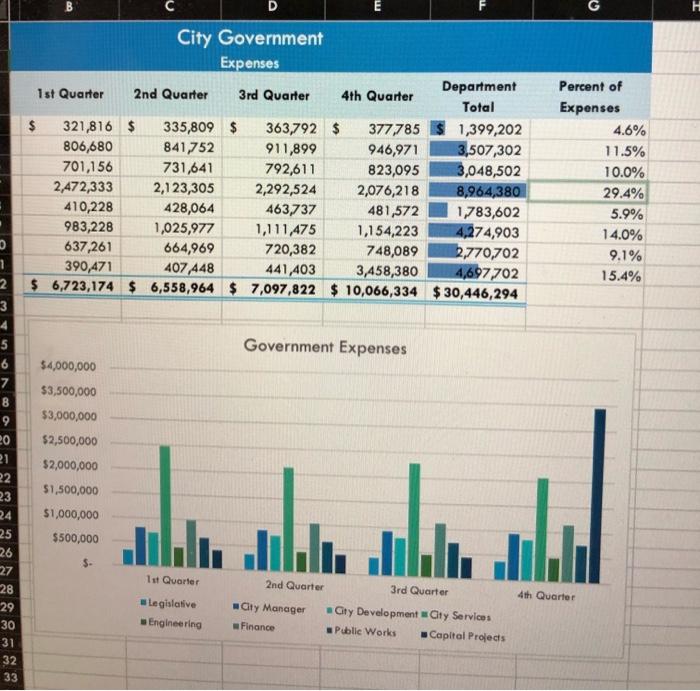
sert Draw Design Layout References Mailings Review >> Tell me Share Arial v 9 V Aa 24 TAG B I Uvab A A Styles Style Pan st Thisons Possible 1 0 2 8 3 B 4 6 5 6 8 10 7 8 Start Excel. Download and open the file named Student MOS19_XL PROUS Charts.xlsx Save the file as Last_First MOS19_XL PROJS Charts Edit the chart to include the 4th Quarter data series Change the RowsColumns so that the Departments are the Legend entries. Resize the chart to the range 814:30, ensuring that the chart is just inside the colleborders Insert a title for the chart and enter Government Expenses Add Alt Text to the chart and enter the description Chart shows a comparison of government expenses for the first through fourth quarters Insert a 3-D Pie Chart comparing the Department Totals using Departments as the legend The chart title will display as Department Total Move the Department Total chart to a new sheet and rename the shoot Pie Chart Apply Chart Style 3, and then apply Colorfu Palette ! On the Expenses worksheet use Quick Analysis to apply Data Bars to the range F4F11. Nole Mac users, apply Solid Blue Data Bars to the range Ensure that the chart is not selected. Insert a Right Block Arrow shape pointing to the Capital Projects data for the 4th Quarter of the Government Expenses chart, Position the shape in row 18 and resize the shape so that the Height is 0 20 and the Width is 1.07 Hint: On the Pie Chart shoot, insert a Text Box in the Department Total chart. Position the text box in the ple shape to the right of the 29% data labol. In the ext boxtypo Largest percent, apply Bold to the test, and then resize the Text Box to Height 0.30 and Width 12 8 6 9 8 10 8 11 8 12 12 13 12 Change the Chart Layout to 1. Use the shipping tool to take a rectangular ship of the Pie Chart Area including the title Copy and then paste the ship incel 12 of the Expenses worksheet Resize the ship so that the upper left comer sits just inside the cell borders of 12. Height 591 and Width 6.67 14 Ensure the worksheets are in the following order Pie Chart Expenses Save and close Last First MOS19 XL PROJS Charts wist Exit Excel Submit the file as directed 400 w TX Fnalishiniert Statal O FACE MacBook Air 80 F3 DA F4 F5 F7 $ 8 D City Government Expenses Department 1st Quarter 2nd Quarter 3rd Quarter 4th Quarter Total 321,816 $ 335,809 $ 363,792 $ 377785 1,399,202 806,680 841,752 911,899 946,971 3,507,302 701,156 731,641 792,611 823,095 3,048,502 2,472,333 2,123,305 2,292,524 2,076,218 8,964,380 410,228 428,064 463,737 481,572 1,783,602 983,228 1,025,977 1,111,475 1,154,223 4,274,903 637,261 664,969 720,382 748,089 2,770,702 390,471 407 448 441,403 3,458,380 4,697702 $ 6,723,174 $ 6,558,964 $ 7,097,822 $ 10,066,334 $ 30,446,294 Percent of Expenses 4.6% 11.5% 10.0% 29.4% 5.9% 14.0% 9.1% 15.4% Government Expenses 1 2 3 4 5 6 7 8 9 20 21 22 23 24 25 26 27 28 29 30 31 32 33 $4,000,000 $3,500,000 $3,000,000 $2,500,000 $2,000,000 $1,500,000 $1,000,000 $500,000 1st Quarter 4th Quarter Legislative - Engineering 2nd Quarter 3rd Quarter City Manager Cty Development Gty Services Finance Public Works Capital Projects sert Draw Design Layout References Mailings Review >> Tell me Share Arial v 9 V Aa 24 TAG B I Uvab A A Styles Style Pan st Thisons Possible 1 0 2 8 3 B 4 6 5 6 8 10 7 8 Start Excel. Download and open the file named Student MOS19_XL PROUS Charts.xlsx Save the file as Last_First MOS19_XL PROJS Charts Edit the chart to include the 4th Quarter data series Change the RowsColumns so that the Departments are the Legend entries. Resize the chart to the range 814:30, ensuring that the chart is just inside the colleborders Insert a title for the chart and enter Government Expenses Add Alt Text to the chart and enter the description Chart shows a comparison of government expenses for the first through fourth quarters Insert a 3-D Pie Chart comparing the Department Totals using Departments as the legend The chart title will display as Department Total Move the Department Total chart to a new sheet and rename the shoot Pie Chart Apply Chart Style 3, and then apply Colorfu Palette ! On the Expenses worksheet use Quick Analysis to apply Data Bars to the range F4F11. Nole Mac users, apply Solid Blue Data Bars to the range Ensure that the chart is not selected. Insert a Right Block Arrow shape pointing to the Capital Projects data for the 4th Quarter of the Government Expenses chart, Position the shape in row 18 and resize the shape so that the Height is 0 20 and the Width is 1.07 Hint: On the Pie Chart shoot, insert a Text Box in the Department Total chart. Position the text box in the ple shape to the right of the 29% data labol. In the ext boxtypo Largest percent, apply Bold to the test, and then resize the Text Box to Height 0.30 and Width 12 8 6 9 8 10 8 11 8 12 12 13 12 Change the Chart Layout to 1. Use the shipping tool to take a rectangular ship of the Pie Chart Area including the title Copy and then paste the ship incel 12 of the Expenses worksheet Resize the ship so that the upper left comer sits just inside the cell borders of 12. Height 591 and Width 6.67 14 Ensure the worksheets are in the following order Pie Chart Expenses Save and close Last First MOS19 XL PROJS Charts wist Exit Excel Submit the file as directed 400 w TX Fnalishiniert Statal O FACE MacBook Air 80 F3 DA F4 F5 F7 $ 8 D City Government Expenses Department 1st Quarter 2nd Quarter 3rd Quarter 4th Quarter Total 321,816 $ 335,809 $ 363,792 $ 377785 1,399,202 806,680 841,752 911,899 946,971 3,507,302 701,156 731,641 792,611 823,095 3,048,502 2,472,333 2,123,305 2,292,524 2,076,218 8,964,380 410,228 428,064 463,737 481,572 1,783,602 983,228 1,025,977 1,111,475 1,154,223 4,274,903 637,261 664,969 720,382 748,089 2,770,702 390,471 407 448 441,403 3,458,380 4,697702 $ 6,723,174 $ 6,558,964 $ 7,097,822 $ 10,066,334 $ 30,446,294 Percent of Expenses 4.6% 11.5% 10.0% 29.4% 5.9% 14.0% 9.1% 15.4% Government Expenses 1 2 3 4 5 6 7 8 9 20 21 22 23 24 25 26 27 28 29 30 31 32 33 $4,000,000 $3,500,000 $3,000,000 $2,500,000 $2,000,000 $1,500,000 $1,000,000 $500,000 1st Quarter 4th Quarter Legislative - Engineering 2nd Quarter 3rd Quarter City Manager Cty Development Gty Services Finance Public Works Capital Projects
Step by Step Solution
There are 3 Steps involved in it

Get step-by-step solutions from verified subject matter experts