

Question: I have a question about quality control. I solved the original question for 9.17, but I am not sure how to redo it for this


I have a question about quality control. I solved the original question for 9.17, but I am not sure how to "redo" it for this added question. or can you explain "Why does an EWMA chart have varying control limits until it reaches steady state?"
Add for 9.17)
Why does an EWMA chart have varying control limits until it reaches steady state? Now, redo the chart but use the steady state limits. It is noted that EWMA charts are robust to departures from the assumption of process Normality. Explains what this means and why this might be an advantage.
Question:
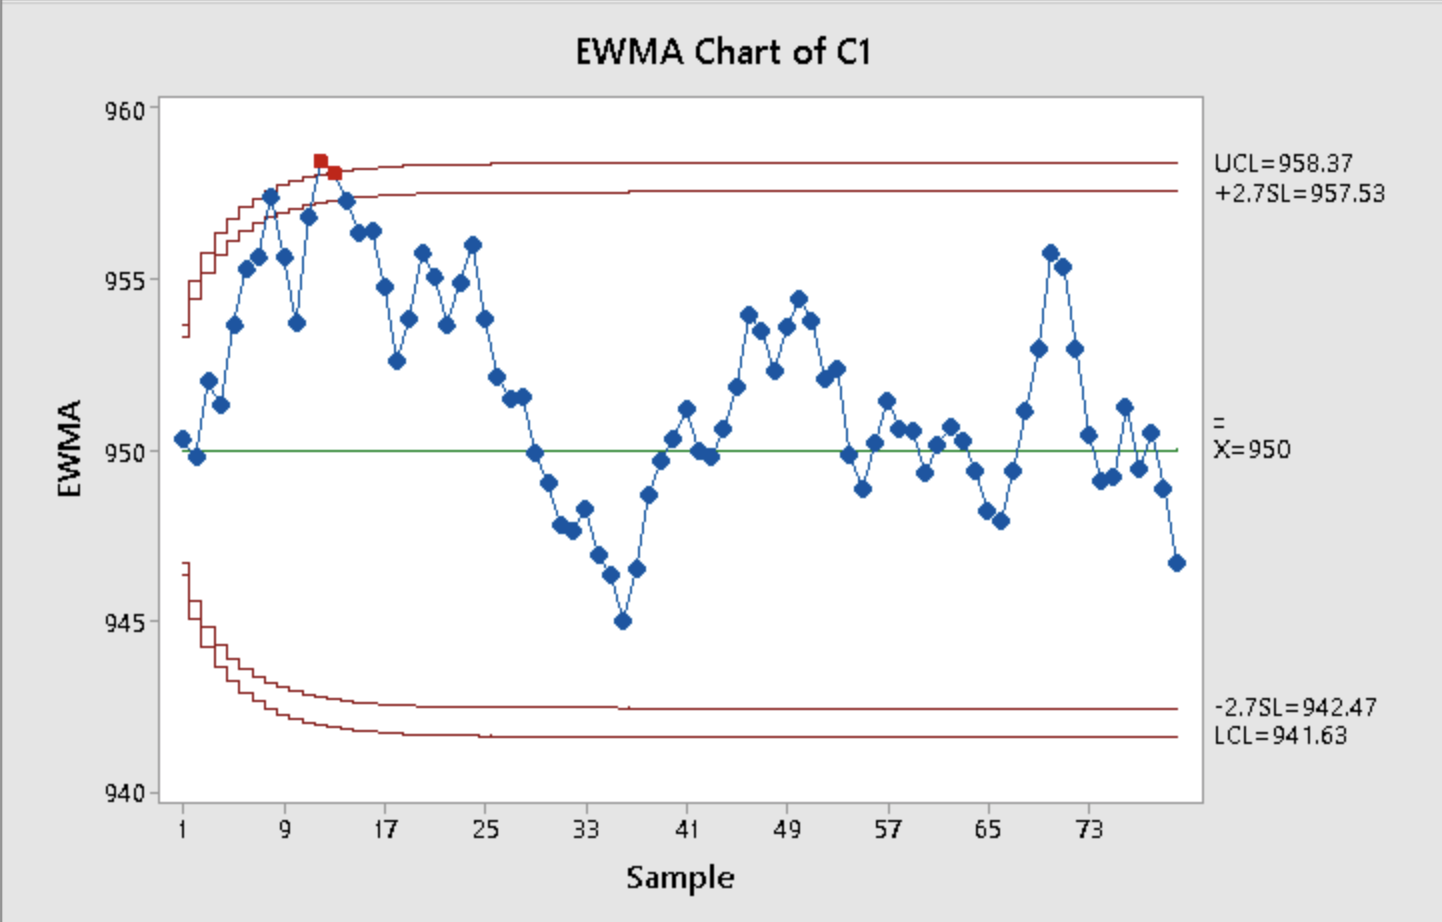


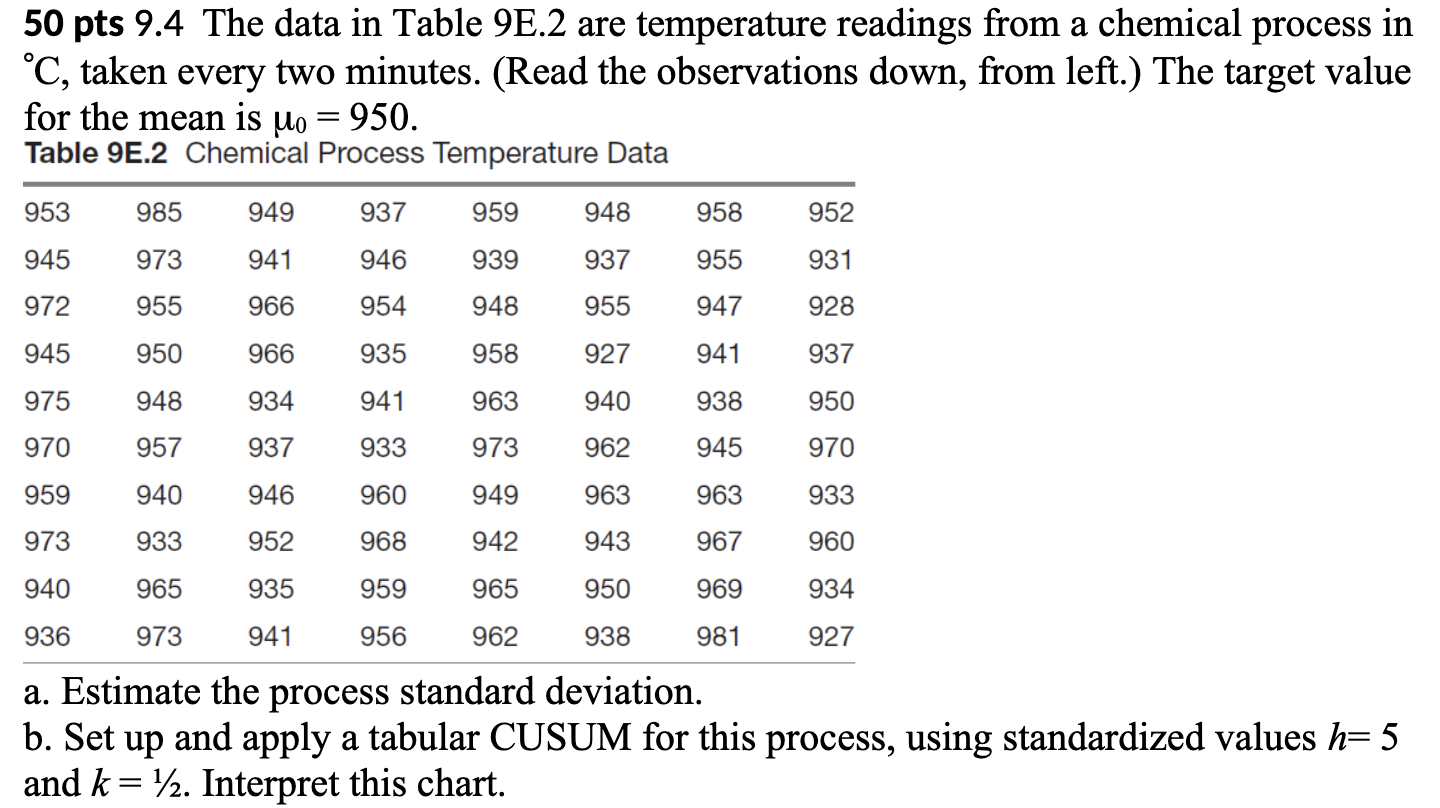
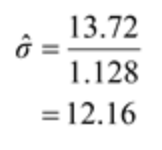
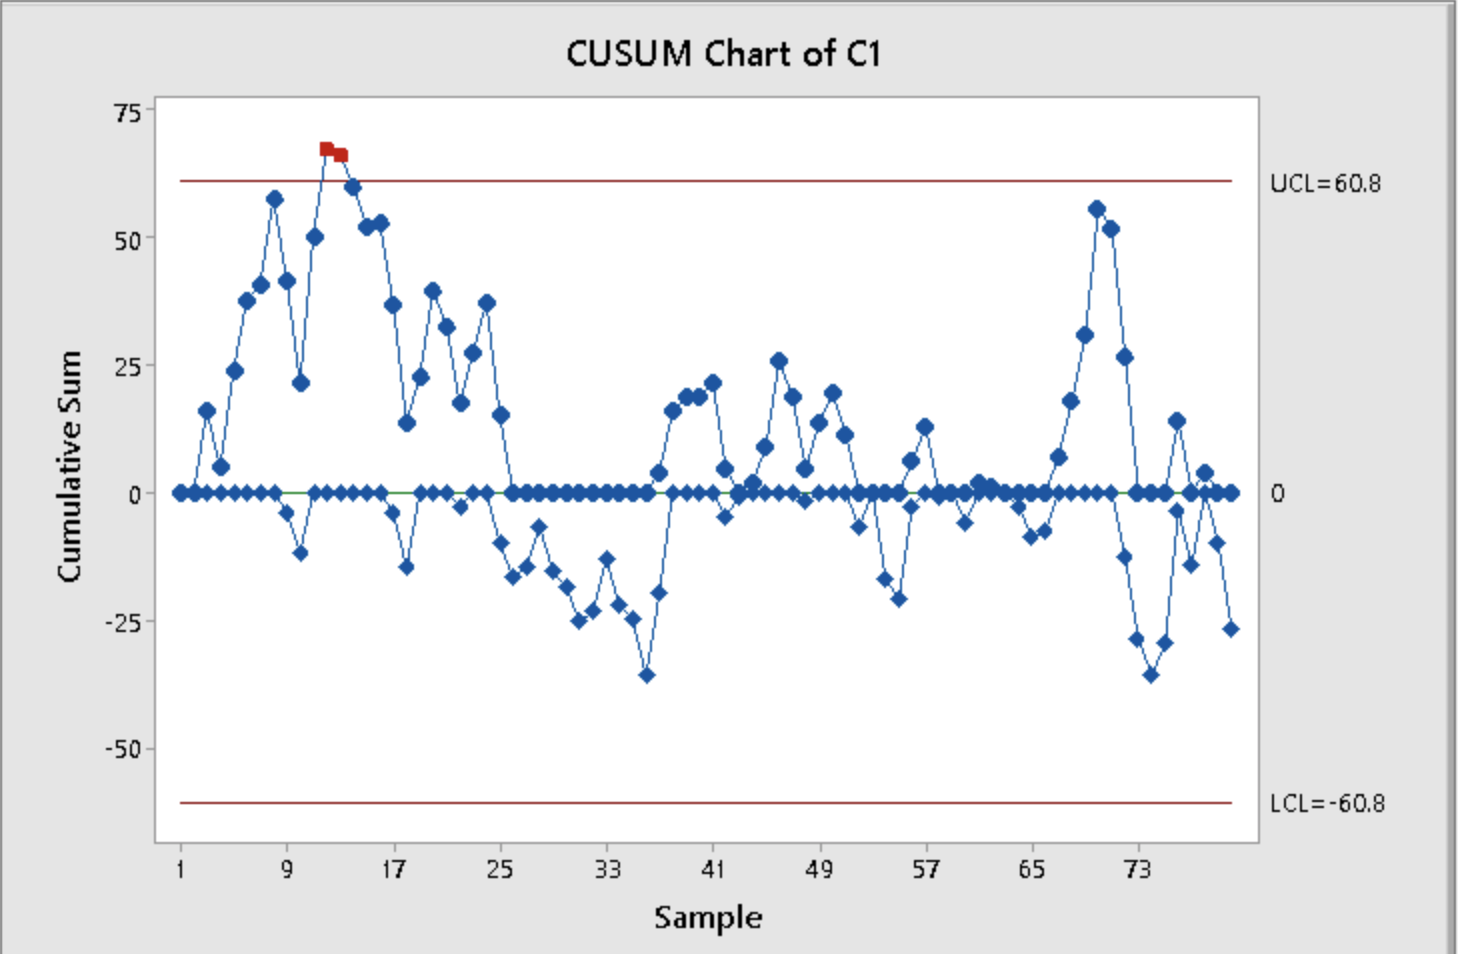
EWMA Chart of C1 960 UCL=958.37 +2.7SL=957.53 955 = EWMA 950 X=950 945 -2.7SL=942.47 LCL=94 1.63 940 9 17 25 33 41 49 57 65 73 SampleCUSUM Chart of C1 75 UCL=60.8 50 25 Cumulative Sum 0- -25 -50- LCL=-60.8 LD 17 25 33 41 49 57 65 73 Sample50 pts 9.17. Reconsider the data in Exercise 9.4 (Table 9E2). Apply an EWMA control chart to these data using 9 = 0.1 and L = 2.7. 50 pts 9.4 The data in Table 9E.2 are temperature readings from a chemical process in C, taken every two minutes. (Read the observations down, from left.) The target value for the mean is Mo = 950. Table 9E.2 Chemical Process Temperature Data 953 985 949 937 959 948 958 952 945 973 941 946 939 937 955 931 972 955 966 954 948 955 947 928 945 950 966 935 958 927 941 937 975 948 934 941 963 940 938 950 970 957 937 933 973 962 945 970 959 940 946 960 949 963 963 933 973 933 952 968 942 943 967 960 940 965 935 959 965 950 969 934 936 973 941 956 962 938 981 927 a. Estimate the process standard deviation. b. Set up and apply a tabular CUSUM for this process, using standardized values 12: 5 and k = 1/2. Interpret this chart. 13.72 1.128 = 12.16
Step by Step Solution
There are 3 Steps involved in it

Get step-by-step solutions from verified subject matter experts