

Question: I have a request, Please answer the math solution step by step and draw the graph by hand. Utility Movies Utility Burgers Utility 66 80
I have a request, Please answer the math solution step by step and draw the graph by hand.
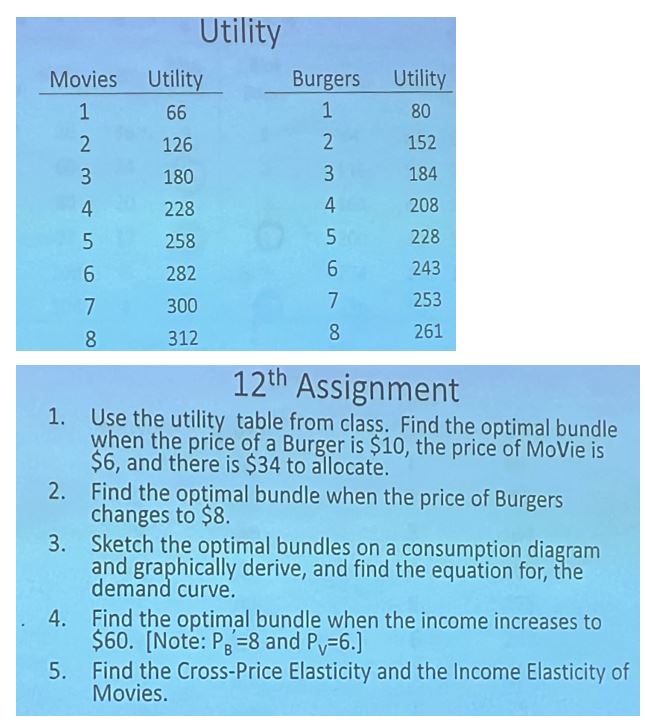
Utility Movies Utility Burgers Utility 66 80 126 152 180 3 184 4 228 208 258 5 228 282 6 243 300 253 312 8 261 12th Assignment 1. Use the utility table from class. Find the optimal bundle when the price of a Burger is $10, the price of Movie is $6, and there is $34 to allocate. 2. Find the optimal bundle when the price of Burgers changes to $8. 3. Sketch the optimal bundles on a consumption diagram and graphically derive, and find the equation for, the demand curve. 4. Find the optimal bundle when the income increases to $60. [Note: PB =8 and Pv=6.] 5. Find the Cross-Price Elasticity and the Income Elasticity of Movies
Step by Step Solution
There are 3 Steps involved in it

Get step-by-step solutions from verified subject matter experts