

Question: I have a simple python question in jupyter notebook?Thanks, Lab 3 Plot: Make four plots in one figure In this exercise, you will create the
I have a simple python question in jupyter notebook?Thanks,
Lab 3 Plot: Make four plots in one figure
In this exercise, you will create the graphs shown in figure 13.1, chapter 1, section 13G Using a computer, on page #31 of your textbook (Boas, Mathematical Methods). Example (on pp31) explains how these plots were created. The graphs must be in a 2X2 matrix, as shown, and should contain labels and titles to identify each graph. The equations used are:
ex*cosx=1+x+x33-x46-x530.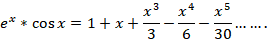
S1=1+x, S3=1+x-x3/3
S4=1+x-x33x46, S5=1+x-x33x46-x530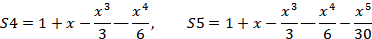
I attached the example from the textbook down here:
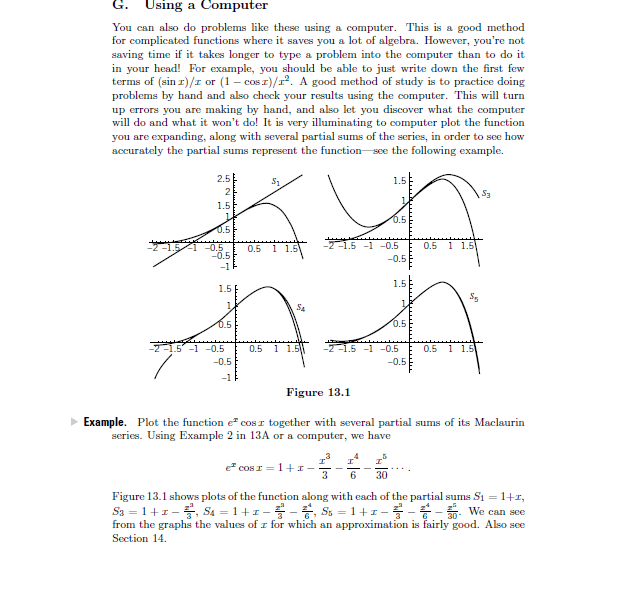
G. Using a Computer You can also do problems like these using a computer. This is a good method for complicated functions where it saves you a lot of algebra. However, you're not saving time if it takes longer to type a problem into the computer than to do it in your head! For example, you should be able to just write down the first few terms of (sin )/ or (1 - cosz). A good method of study is to practice doing problems by hand and also check your results using the computer. This will turn up errors you are making by hand, and also let you discover what the computer will do and what it won't do! It is very illuminating to computer plot the function you are expanding, along with several partial sums of the series, in order to see how accurately the partial sums represent the function see the following example. S1 1.5 S3 0.5 1 1.5 5-1-0.5 0.5 1 1.5 -0.5 -0.5 5-1-0.5 0.5 11 -0.5 -0.5 -1 Figure 13.1 Example. Plot the function ecosr together with several partial sums of its Maclaurin series. Using Example 2 in 13A or a computer, we have 3 630 Figure 13.1 shows plots of the function along with each of the partial sums Si 1r from the graphs the values of r for which an approximation is fairly good. Also see Section 14
Step by Step Solution
There are 3 Steps involved in it

Get step-by-step solutions from verified subject matter experts