

Question: I have almost solved the question and generated the output in Excel. However, I need your help to conclude null and alternative hypothesis in this
I have almost solved the question and generated the output in Excel. However, I need your help to conclude null and alternative hypothesis in this question. Relevant documents are attached. The first column is for "Profit" Objective and the second column is for "Non-Profit" Objective for 2018 return. I just need your explanation for null and alternative hypothesis and the conclusion of this question in terms of decision-making (no profits have lower returns or not). Thank you so much.
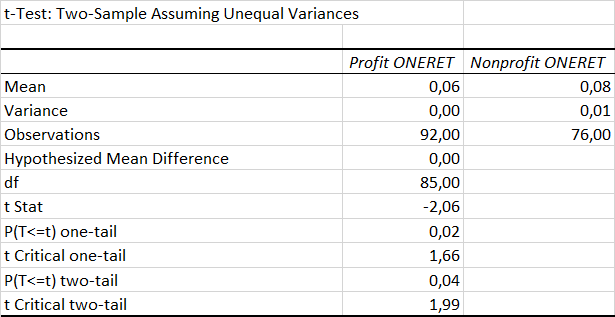
t-Test: Two-Sample Assuming Unequal Variances Profit ONERET Nonprofit ONERET Mean 0,06 0,08 Variance 0,00 0,01 Observations 92,00 76,00 Hypothesized Mean Difference 0,00 df 85,00 t Stat -2,06 P(T
Step by Step Solution
There are 3 Steps involved in it

Get step-by-step solutions from verified subject matter experts