

Question: I have an assignment from a quality control class. Could you check if my answers are correct? Especially, I am confused about the last question.
I have an assignment from a quality control class. Could you check if my answers are correct?
Especially, I am confused about the last question.
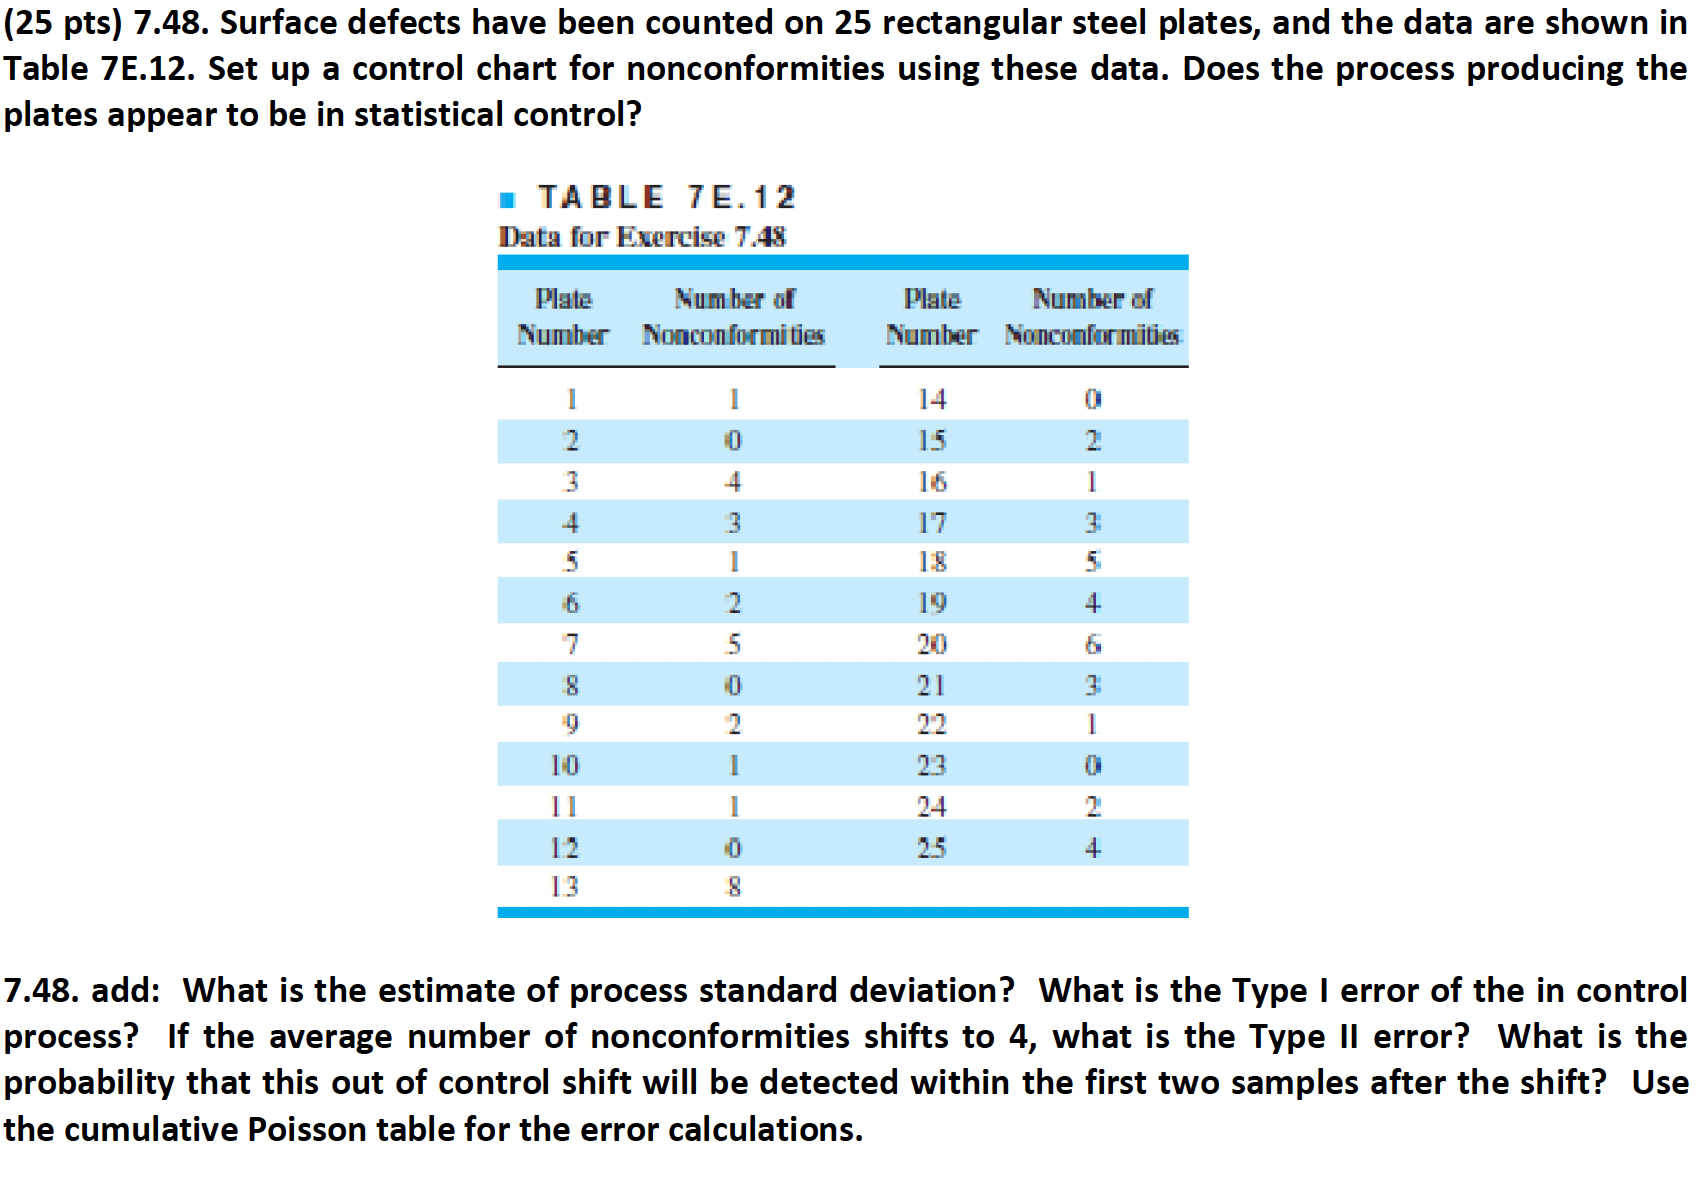
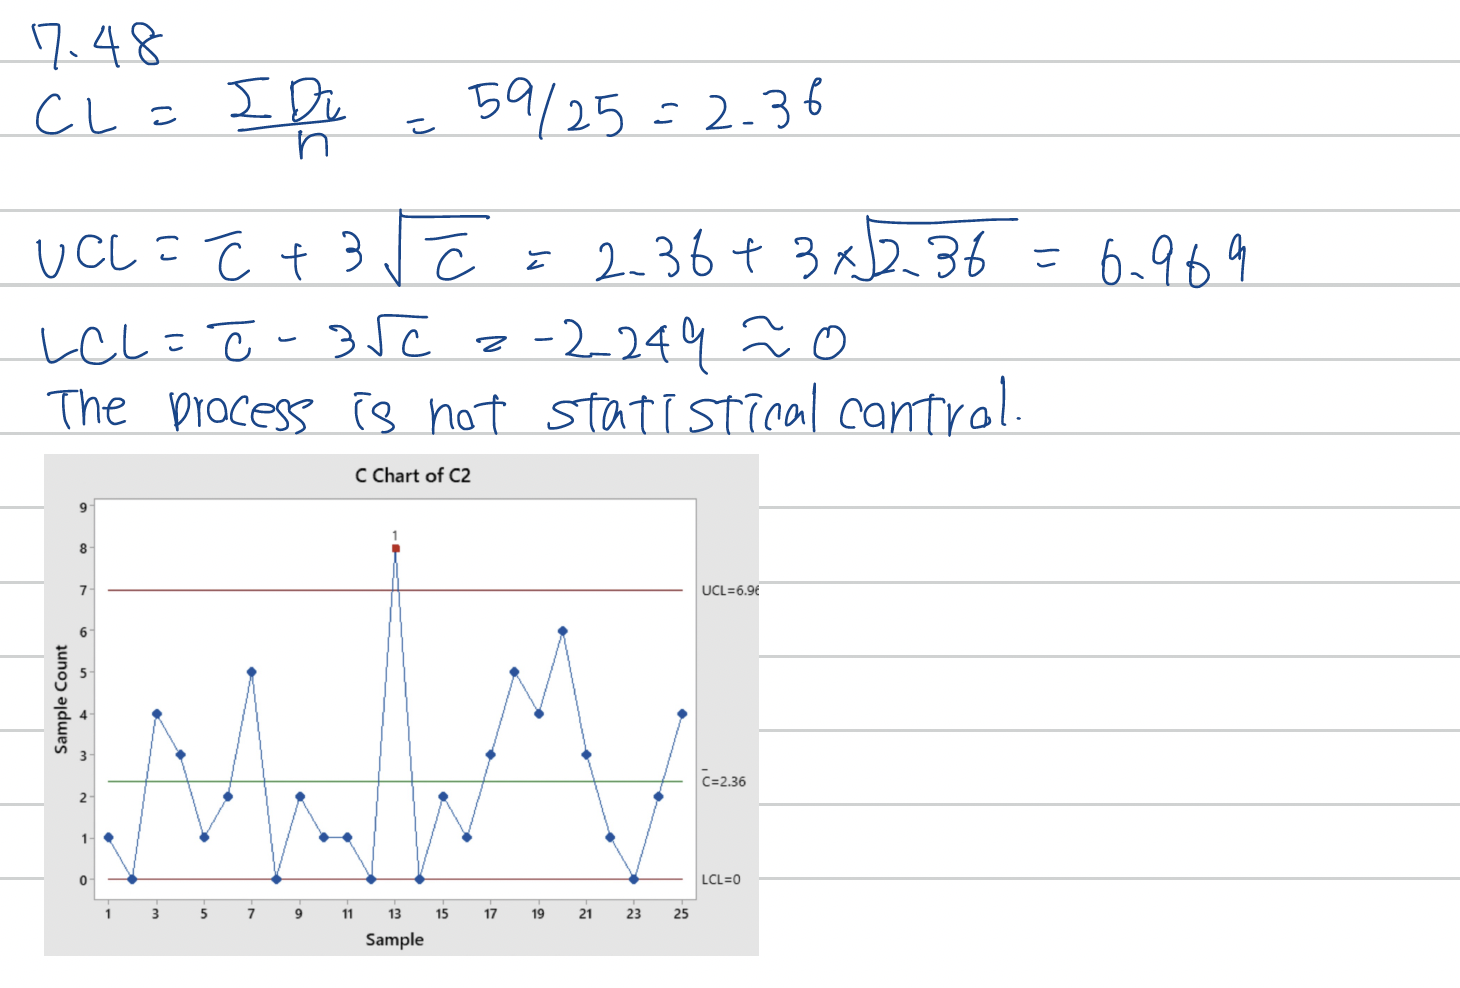
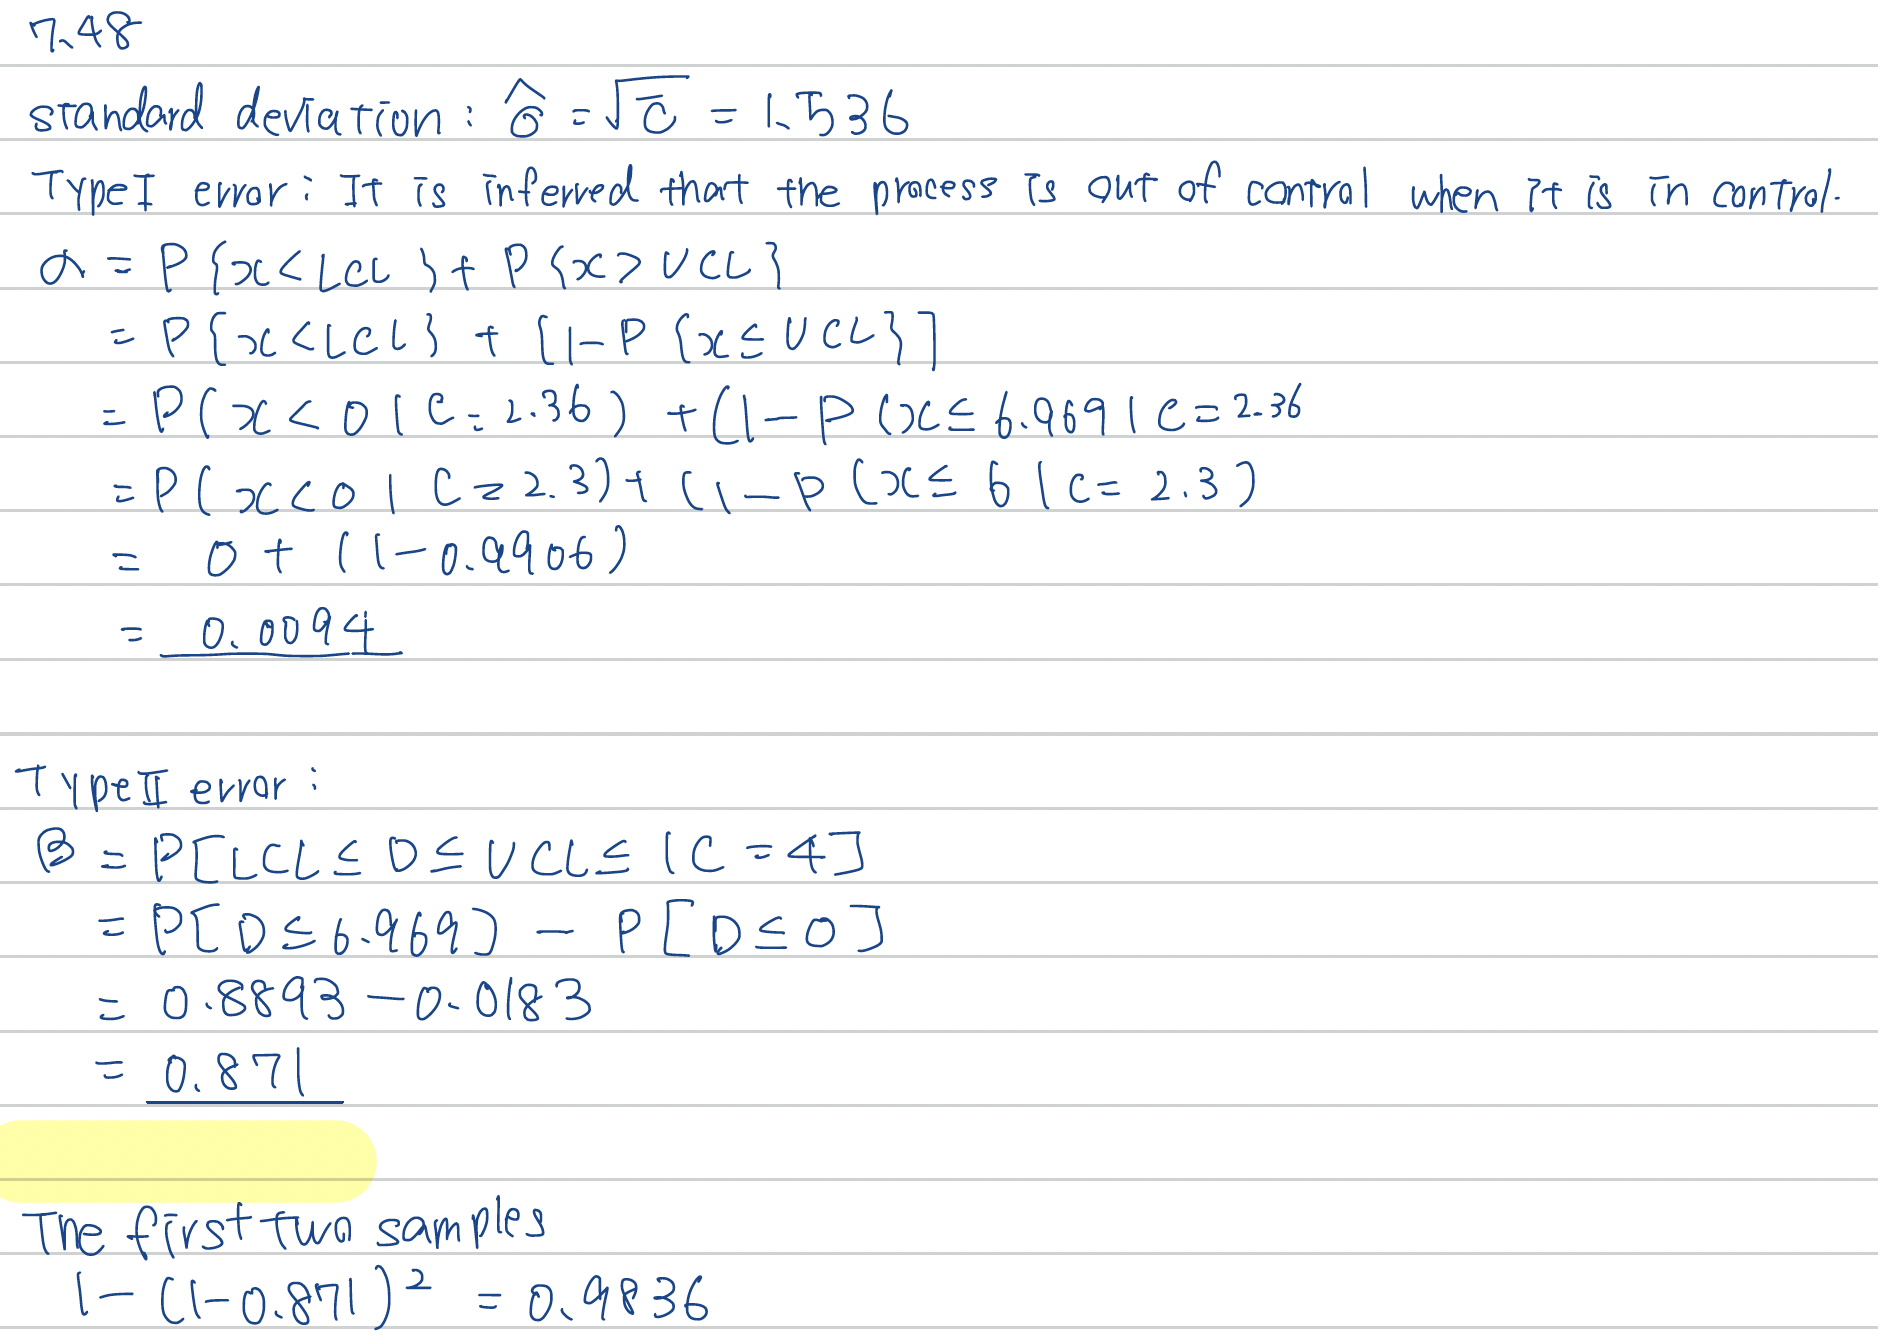
(25 pts) 7.48. Surface defects have been counted on 25 rectangular steel plates, and the data are shown in Table 7E.12. Set up a control chart for nonconformities using these data. Does the process producing the plates appear to be in statistical control? . TABLE 7E. 12 Data for Exercise 7.48 Plate Number of Plate Number of Number Nonconformities Number Nonconformities 14 15 16 17 18 + ECREES + 12 25 13 7.48. add: What is the estimate of process standard deviation? What is the Type I error of the in control process? If the average number of nonconformities shifts to 4, what is the Type II error? What is the probability that this out of control shift will be detected within the first two samples after the shift? Use the cumulative Poisson table for the error calculations.17.48 CL = 2 DV - 59/ 25 = 2- 36 n V CC = C + 3 J C = 2 - 36 + 3 x 2 36 = 6. 96 9 L CL = C - 35C z - 2 249 20 The process is hot statistical control. C Chart of C2 7 UCL=6.96 Sample Count w C = 2.36 N LCL=0 3 5 7 9 11 13 15 17 19 21 23 25 Sample7148 standard deviation : 6 = JC = 1 536 TypeI error : It is inferred that the process is out of contral when it is in control. = P / J C > U CL ] = P [ OC c = 6. 96 9 1 e = 2.36 = P ( - c
Step by Step Solution
There are 3 Steps involved in it

Get step-by-step solutions from verified subject matter experts